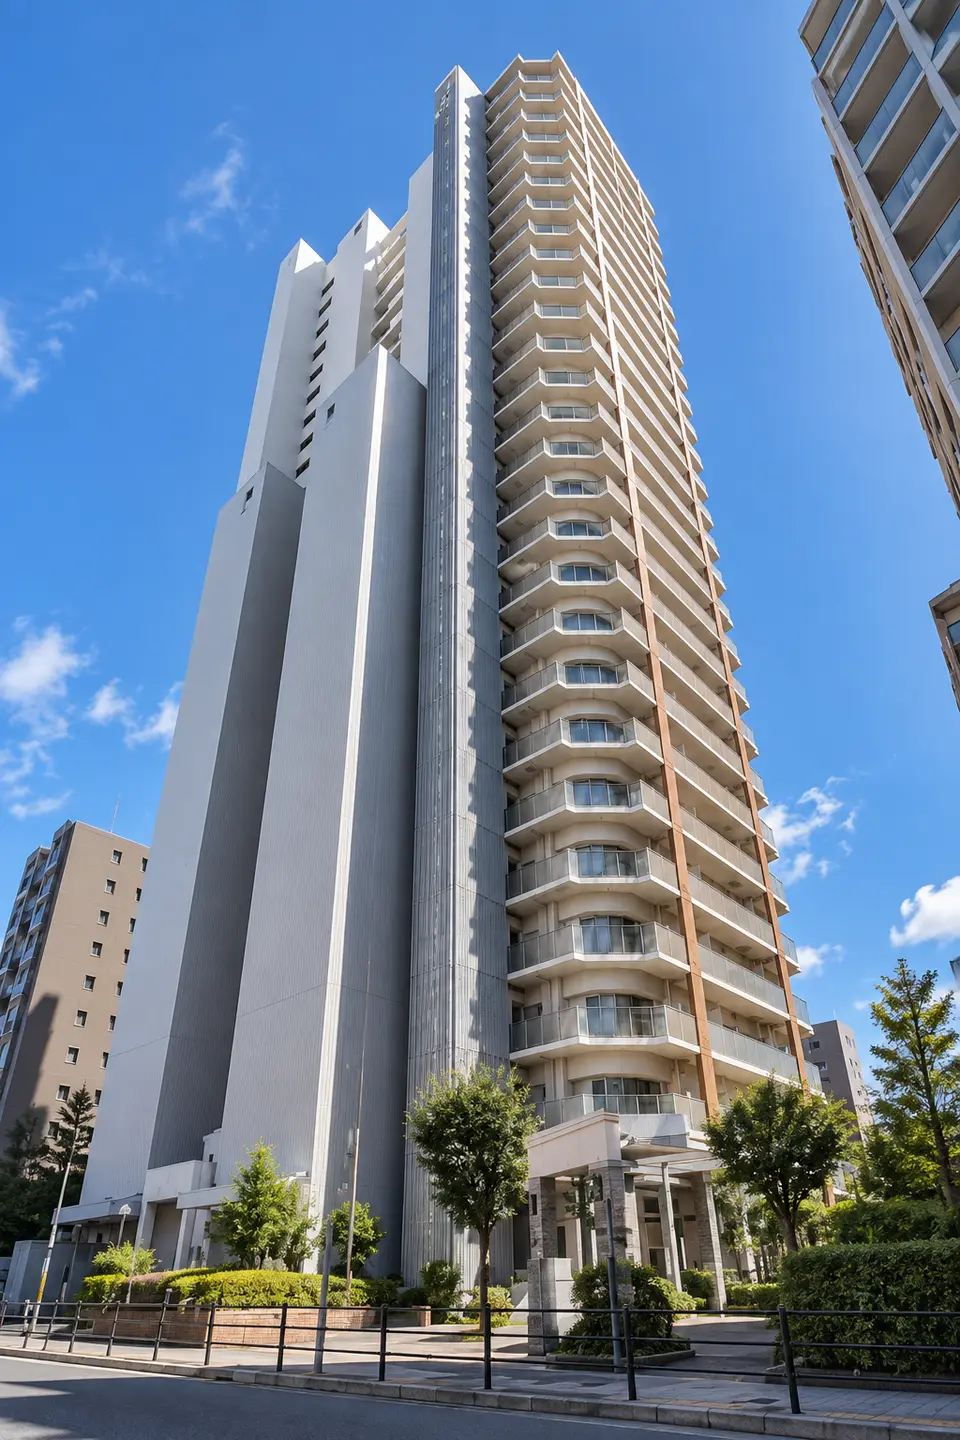
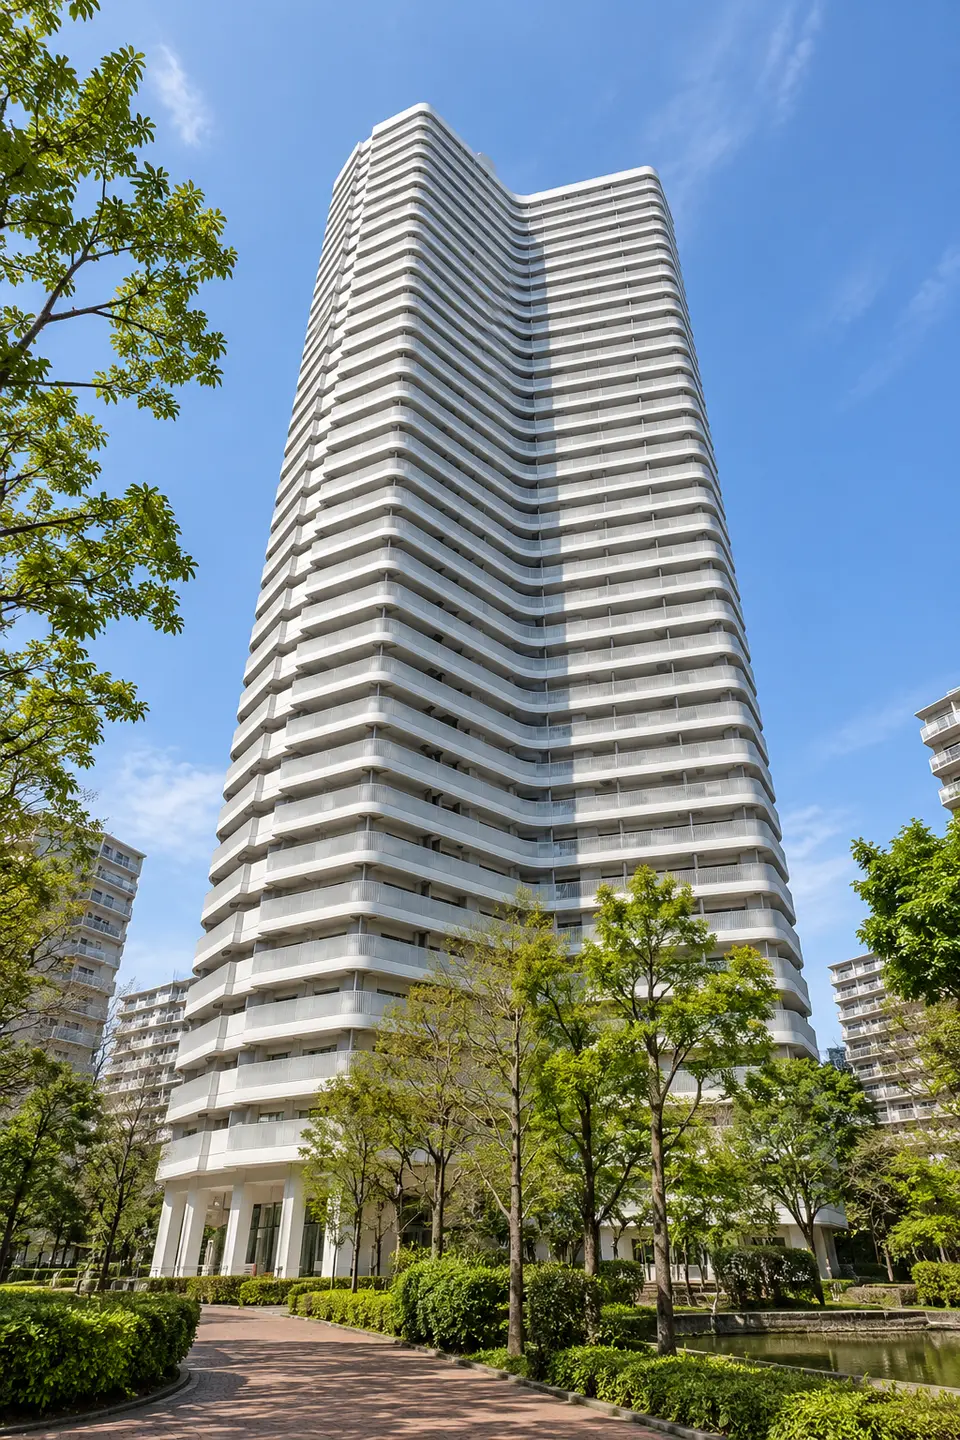
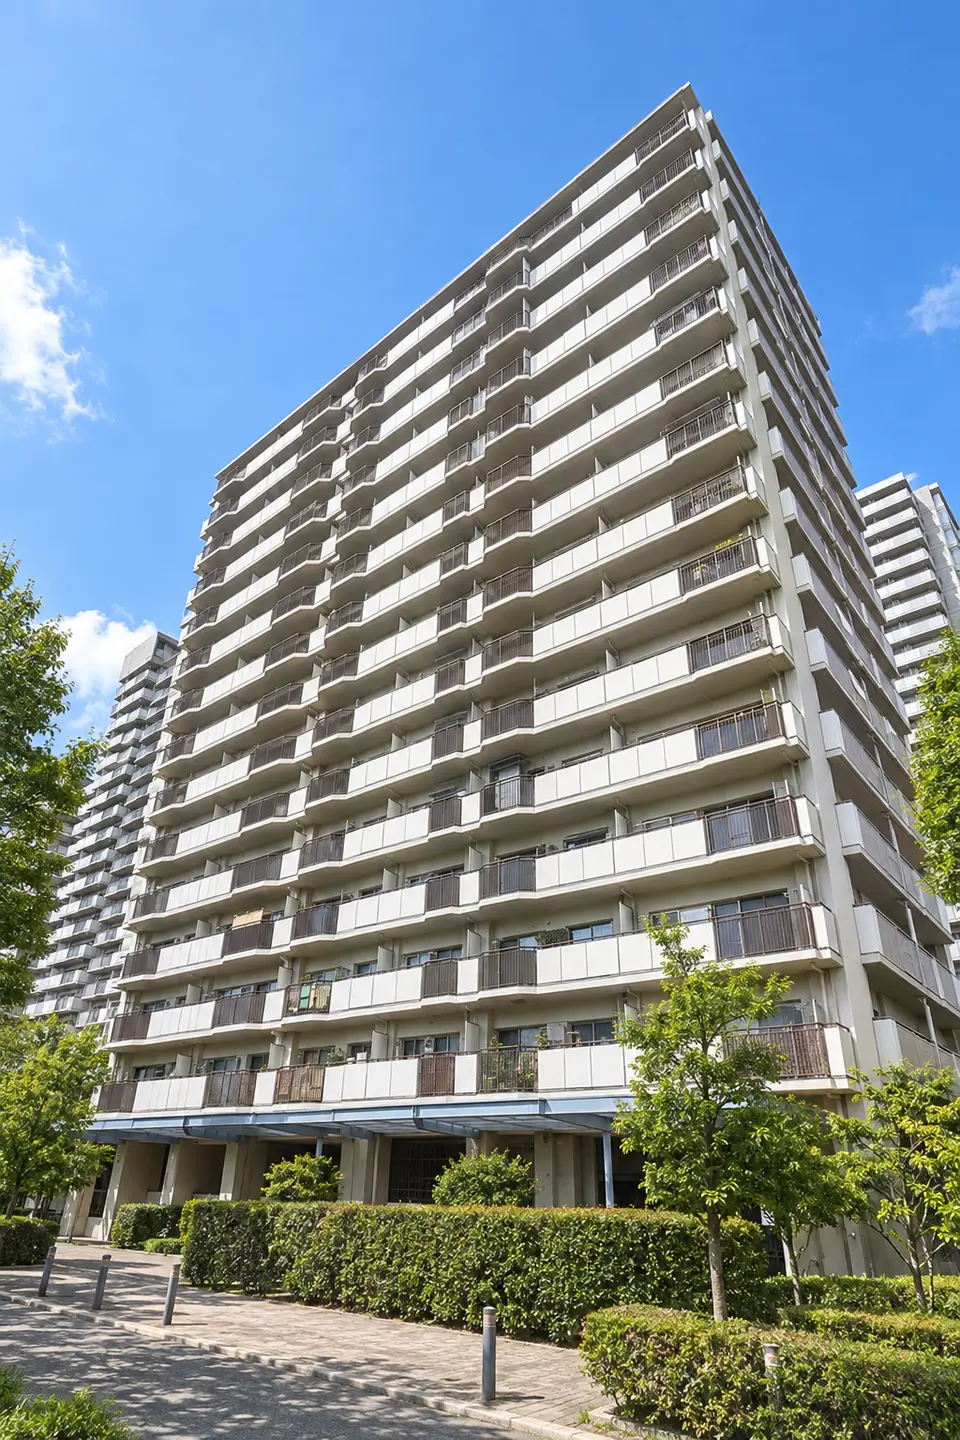
Image|This is a generated image and does not depict an actual streetscape or building.
Appreciation Potential Unit Picks
Ranked by the dimension that evaluates factors supporting price appreciation based on nearby land-value and transaction-price trends.Best suited toPeople who place greater weight on trends in nearby land values and transaction prices。
The Appreciation Potential type ranks active for-sale units by their TOWERS SELECT INVESTMENT INDEX Appreciation Potential score.5,608 eligible units; calculated on 2026-10-21.
Home
Picks by Investment Type
Appreciation Potential
Understand the Reasons Behind the Score
Along with the total score, check each metric and the date of the data.
Overall Balance Appreciation Potential Value Purchase Asset Quality Liquidity Income Potential
Appreciation Potential Rank
Filter (Miyakojima Ward) matches: 17 units (out of 5,608 units total). Rankings are within the filtered results; top-percent figures are relative to all units.
Area: Osaka, Miyakojima Ward, Nakanocho 5-chome
Asking Price 5,480 ¥10,000 212 ¥10,000/tsubo
Appreciation Potential
45.9 Top 78%
Overall
50.4 Top 45%
Layout 3LDK
Area 85.37 ㎡
Floor 5 floor
Orientation South
View scoring details
Five-year average annual change in nearby land values: +7.1% Year-on-year change in nearby land values: +12.1%
Sale Valuation Approx.5,358 ¥10,000
Rent Valuation Approx. Monthly21.4 ¥10,000
Projected cash flow Standard assumptions: 3.0% annual interest, 80% financing, 35-year level-payment loan
Area: Osaka, Miyakojima Ward, Nakanocho 5-chome
Asking Price 6,480 ¥10,000 245 ¥10,000/tsubo
Appreciation Potential
45.9 Top 78%
Overall
47.6 Top 77%
Layout 3LDK
Area 87.33 ㎡
Floor 5 floor
Orientation West
View scoring details
Five-year average annual change in nearby land values: +7.1% Year-on-year change in nearby land values: +12.1%
Sale Valuation Approx.5,214 ¥10,000
Rent Valuation Approx. Monthly21.3 ¥10,000
Projected cash flow Standard assumptions: 3.0% annual interest, 80% financing, 35-year level-payment loan
Area: Osaka, Miyakojima Ward, Tomobuchicho 1-chome
Asking Price 4,580 ¥10,000 244 ¥10,000/tsubo
Appreciation Potential
44.8 Top 82%
Overall
48.7 Top 65%
Layout 2LDK
Area 62.17 ㎡
Floor 7 floor
Orientation East
View scoring details
Five-year average annual change in nearby land values: +5.3% Year-on-year change in nearby land values: +8.3%
Sale Valuation Approx.4,377 ¥10,000
Rent Valuation Approx. Monthly17.8 ¥10,000
Projected cash flow Standard assumptions: 3.0% annual interest, 80% financing, 35-year level-payment loan
Area: Osaka, Miyakojima Ward, Tomobuchicho 1-chome
Asking Price 6,980 ¥10,000 260 ¥10,000/tsubo
Appreciation Potential
44.8 Top 82%
Overall
49.7 Top 53%
Layout 4LDK
Area 88.71 ㎡
Floor 17 floor
Orientation South
View scoring details
Five-year average annual change in nearby land values: +5.3% Year-on-year change in nearby land values: +8.3%
Sale Valuation Approx.6,733 ¥10,000
Rent Valuation Approx. Monthly26.2 ¥10,000
Projected cash flow Standard assumptions: 3.0% annual interest, 80% financing, 35-year level-payment loan
Area: Osaka, Miyakojima Ward, Tomobuchicho 1-chome
Asking Price 7,180 ¥10,000 307 ¥10,000/tsubo
Appreciation Potential
44.8 Top 82%
Overall
47.3 Top 80%
Layout 3LDK
Area 77.43 ㎡
Floor 31 floor
Orientation Northeast
View scoring details
Five-year average annual change in nearby land values: +5.3% Year-on-year change in nearby land values: +8.3%
Sale Valuation Approx.5,498 ¥10,000
Rent Valuation Approx. Monthly25.2 ¥10,000
Projected cash flow Standard assumptions: 3.0% annual interest, 80% financing, 35-year level-payment loan
Area: Osaka, Miyakojima Ward, Tomobuchicho 1-chome
Asking Price 7,380 ¥10,000 302 ¥10,000/tsubo
Appreciation Potential
44.8 Top 82%
Overall
46.8 Top 83%
Layout 2LDK+S (storage room)
Area 80.88 ㎡
Floor 19 floor
Orientation South
Occupancy Vacant
View scoring details
Five-year average annual change in nearby land values: +5.3% Year-on-year change in nearby land values: +8.3%
Sale Valuation Approx.5,637 ¥10,000
Rent Valuation Approx. Monthly25.0 ¥10,000
Projected cash flow Standard assumptions: 3.0% annual interest, 80% financing, 35-year level-payment loan
Area: Osaka, Miyakojima Ward, Tomobuchicho 1-chome
Asking Price 8,990 ¥10,000 286 ¥10,000/tsubo
Appreciation Potential
44.8 Top 82%
Overall
49.2 Top 59%
Layout 2LDK
Area 103.75 ㎡
Floor 33 floor
Orientation East
Occupancy Vacant
View scoring details
Five-year average annual change in nearby land values: +5.3% Year-on-year change in nearby land values: +8.3%
Sale Valuation Approx.8,014 ¥10,000
Rent Valuation Approx. Monthly38.8 ¥10,000
Projected cash flow Standard assumptions: 3.0% annual interest, 80% financing, 35-year level-payment loan
Area: Osaka, Miyakojima Ward, Nakanocho 5-chome
Asking Price 6,480 ¥10,000 227 ¥10,000/tsubo
Appreciation Potential
44.8 Top 82%
Overall
50.4 Top 45%
Layout 2LDK
Area 94.21 ㎡
Floor 26 floor
Orientation South
View scoring details
Five-year average annual change in nearby land values: +6.9% Year-on-year change in nearby land values: +12.5%
Sale Valuation Approx.6,093 ¥10,000
Rent Valuation Approx. Monthly25.9 ¥10,000
Projected cash flow Standard assumptions: 3.0% annual interest, 80% financing, 35-year level-payment loan
Area: Osaka, Miyakojima Ward, Nakanocho 5-chome
Asking Price 6,490 ¥10,000 228 ¥10,000/tsubo
Appreciation Potential
44.8 Top 82%
Overall
50.3 Top 47%
Layout 2LDK
Area 94.21 ㎡
Floor 28 floor
Orientation West
View scoring details
Five-year average annual change in nearby land values: +6.9% Year-on-year change in nearby land values: +12.5%
Sale Valuation Approx.5,986 ¥10,000
Rent Valuation Approx. Monthly25.7 ¥10,000
Projected cash flow Standard assumptions: 3.0% annual interest, 80% financing, 35-year level-payment loan
Area: Osaka, Miyakojima Ward, Nakanocho 5-chome
Asking Price 7,380 ¥10,000 253 ¥10,000/tsubo
Appreciation Potential
44.8 Top 82%
Overall
48.2 Top 71%
Layout 3LDK
Area 96.31 ㎡
Floor 20 floor
Orientation West
Occupancy Vacant
View scoring details
Five-year average annual change in nearby land values: +6.9% Year-on-year change in nearby land values: +12.5%
Sale Valuation Approx.6,175 ¥10,000
Rent Valuation Approx. Monthly25.1 ¥10,000
Projected cash flow Standard assumptions: 3.0% annual interest, 80% financing, 35-year level-payment loan
Area: Osaka, Miyakojima Ward, Nakanocho 5-chome
Asking Price 13,800 ¥10,000 287 ¥10,000/tsubo
Appreciation Potential
44.8 Top 82%
Overall
48.6 Top 67%
Layout 2LDK
Area 158.90 ㎡
Floor 38 floor
Orientation West
View scoring details
Five-year average annual change in nearby land values: +6.9% Year-on-year change in nearby land values: +12.5%
Sale Valuation Approx.11,974 ¥10,000
Rent Valuation Approx. Monthly49.0 ¥10,000
Projected cash flow Standard assumptions: 3.0% annual interest, 80% financing, 35-year level-payment loan
Area: Osaka, Miyakojima Ward, Miyakojimakitadori 2-chome
Asking Price 5,380 ¥10,000 257 ¥10,000/tsubo
Appreciation Potential
42.5 Top 90%
Overall
45.2 Top 92%
Layout 3LDK
Area 69.26 ㎡
Floor 6 floor
Orientation East
View scoring details
Five-year average annual change in nearby land values: +5.9% Year-on-year change in nearby land values: +8.8%
Sale Valuation Approx.4,629 ¥10,000
Rent Valuation Approx. Monthly17.9 ¥10,000
Projected cash flow Standard assumptions: 3.0% annual interest, 80% financing, 35-year level-payment loan
Area: Osaka, Miyakojima Ward, Tomobuchicho 1-chome
Asking Price 3,999 ¥10,000 213 ¥10,000/tsubo
Appreciation Potential
41.9 Top 92%
Overall
48.8 Top 64%
Layout 2LDK
Area 62.20 ㎡
Floor 35 floor
Orientation Southwest
View scoring details
Five-year average annual change in nearby land values: +4.3% Year-on-year change in nearby land values: +7.8%
Sale Valuation Approx.3,201 ¥10,000
Rent Valuation Approx. Monthly16.4 ¥10,000
Projected cash flow Standard assumptions: 3.0% annual interest, 80% financing, 35-year level-payment loan
Area: Osaka, Miyakojima Ward, Tomobuchicho 1-chome
Asking Price 4,580 ¥10,000 177 ¥10,000/tsubo
Appreciation Potential
41.9 Top 92%
Overall
50.9 Top 39%
Layout 3LDK
Area 85.31 ㎡
Floor 21 floor
Orientation South
Occupancy Vacant
View scoring details
Five-year average annual change in nearby land values: +4.3% Year-on-year change in nearby land values: +7.8%
Sale Valuation Approx.4,283 ¥10,000
Rent Valuation Approx. Monthly20.6 ¥10,000
Projected cash flow Standard assumptions: 3.0% annual interest, 80% financing, 35-year level-payment loan
Area: Osaka, Miyakojima Ward, Tomobuchicho 1-chome
Asking Price 4,480 ¥10,000 177 ¥10,000/tsubo
Appreciation Potential
40.7 Top 96%
Overall
47.5 Top 78%
Layout 2LDK
Area 83.90 ㎡
Floor 15 floor
Orientation South
View scoring details
Five-year average annual change in nearby land values: +4.5% Year-on-year change in nearby land values: +7.9%
Sale Valuation Approx.3,672 ¥10,000
Rent Valuation Approx. Monthly19.2 ¥10,000
Projected cash flow Standard assumptions: 3.0% annual interest, 80% financing, 35-year level-payment loan
Area: Osaka, Miyakojima Ward, Tomobuchicho 1-chome
Asking Price 4,680 ¥10,000 166 ¥10,000/tsubo
Appreciation Potential
40.7 Top 96%
Overall
48.6 Top 66%
Layout 3LDK
Area 93.16 ㎡
Floor 16 floor
Orientation Southeast
View scoring details
Five-year average annual change in nearby land values: +4.5% Year-on-year change in nearby land values: +7.9%
Sale Valuation Approx.4,146 ¥10,000
Rent Valuation Approx. Monthly20.2 ¥10,000
Projected cash flow Standard assumptions: 3.0% annual interest, 80% financing, 35-year level-payment loan
Area: Osaka, Miyakojima Ward, Tomobuchicho 1-chome
Asking Price 4,790 ¥10,000 163 ¥10,000/tsubo
Appreciation Potential
40.7 Top 96%
Overall
50.9 Top 39%
Layout 1LDK
Area 97.40 ㎡
Floor 35 floor
Orientation South
View scoring details
Five-year average annual change in nearby land values: +4.5% Year-on-year change in nearby land values: +7.9%
Sale Valuation Approx.4,608 ¥10,000
Rent Valuation Approx. Monthly25.2 ¥10,000
Projected cash flow Standard assumptions: 3.0% annual interest, 80% financing, 35-year level-payment loan
Included and excluded units
Eligible units 5,608 units
Excluded 116 units
INDEX calculation date 2026-10-21
Listing update 2026-10-20 20:02
Includes currently listed units available for purchase that have a TOWERS SELECT INVESTMENT INDEX for the latest calculation date. Tenant-occupied investment units are included and identified on each card.
Excluded units by reason
Not yet completed: 28 units
INDEX not calculated (Asking price differs substantially from listings of similar size): 3 units INDEX not calculated (Excluded from sale valuation because the building is rental-only): 1 units INDEX not calculated (Land tenure unverified): 2 units INDEX not calculated (Listed for more than 365 days): 38 units INDEX not calculated (Missing management fee): 23 units INDEX not calculated (Missing price, floor area, or floor level): 1 units INDEX not calculated (Missing repair reserve): 2 units INDEX not calculated (Missing total unit count): 18 units
This analysis is for reference and is based on TOWERS.SELECT's proprietary scoring. It does not guarantee investment results. Make decisions based on your own due diligence and consultation with qualified professionals.
Scores are relative ratings centered on 50 among eligible units, not absolute scores out of 100 or predictions of future appreciation or sales. Sale estimates, rent estimates, and projected cash flow use fixed assumptions for comparison and do not guarantee contract terms or net proceeds.