
Japan High-Rise Condominium Market
We compile daily figures for active inventory, prices, and days listed in each published area. We do not estimate past values; history begins only on successful collection dates. Comparisons over 1, 7, 30, and 180 days and 1 year are published automatically as soon as both endpoints are available.
Track Japan's high-rise condominium market through inventory, prices, and days listed in each published area, beginning with successful daily collection dates. Comparisons over 1, 7, 30, and 180 days and 1 year are enabled automatically as soon as both endpoints are available.
Top 3 price drops on the latest check date
— comparing sale listings with detected price reductions across all published areas. The check date may differ from the actual date of the price change.
View All Price Revisions and New Listings-
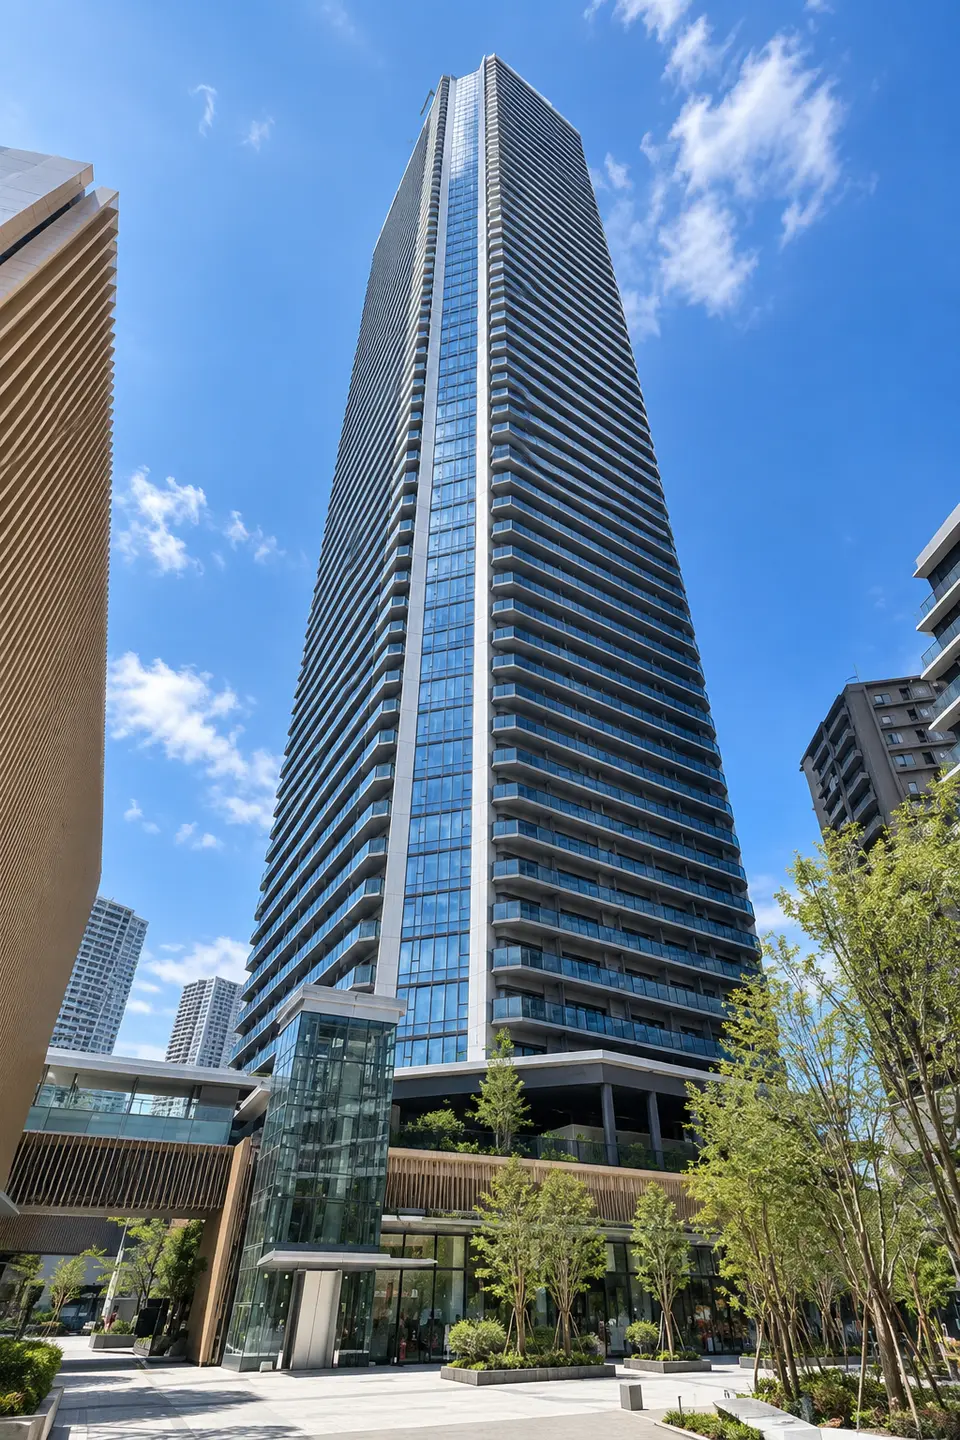 01 placePrice reduction−16.4%
GRAND DO CITY TOWER TSUKISHIMA Floor 57
Chuo Ward・2LDK・55.82㎡
- Previous
JPY 239,000,000- Current price
- JPY 199,900,000
-
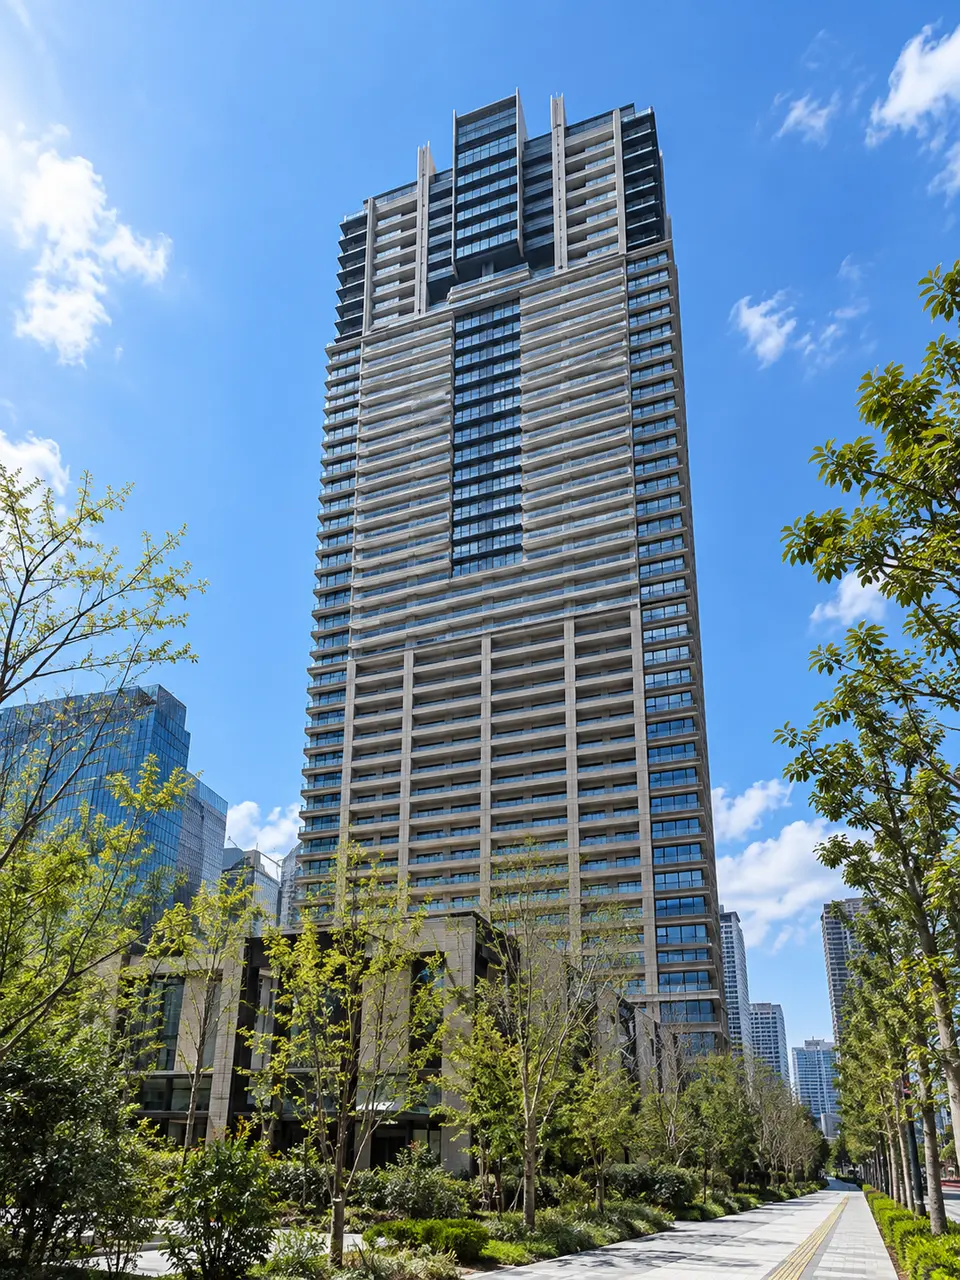 02 placePrice reduction−16.1%
GRAND GREEN OSAKA Floor 23
Kita Ward, Osaka・1LDK・61.32㎡
- Previous
JPY 218,800,000- Current price
- JPY 183,600,000
-
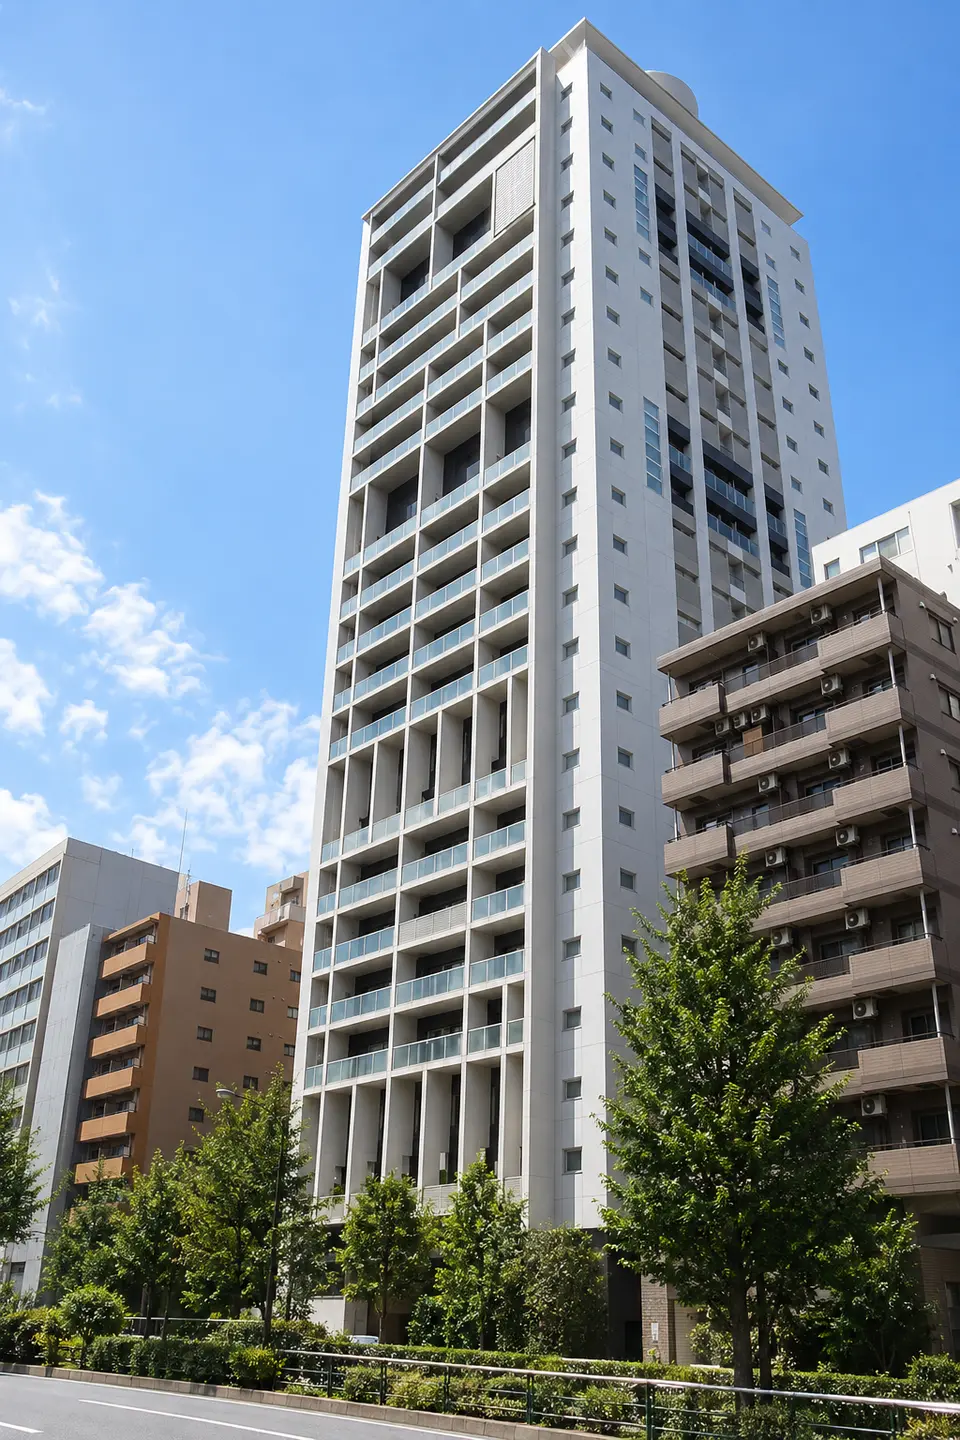 03 placePrice reduction−15.5%
AKUSHIA AZABU Floor 18
Minato Ward・1LDK・55.87㎡
- Previous
JPY 200,000,000- Current price
- JPY 169,000,000
Market Trends by Area
-
Tokyo 23 Wards Market Trends
Active listings
- For sale
- 3,237 units Comparison: 1 day・7 days・30 days
- For rent
- 2,801 units Comparison: 1 day・7 days・30 days
-
Yokohama Market Trends
Active listings
- For sale
- 217 units Comparison: 1 day・7 days・30 days
- For rent
- 112 units Comparison: 1 day・7 days・30 days
-

Osaka Market Trends
Active listings
- For sale
- 1,285 units Comparison: 1 day・7 days・30 days
- For rent
- 1,067 units Comparison: 1 day・7 days・30 days
-
Nagoya Market Trends
Active listings
- For sale
- 116 units Comparison: 1 day・7 days・30 days
- For rent
- 370 units Comparison: 1 day・7 days・30 days
-
Fukuoka Market Trends
Active listings
- For sale
- 161 units Comparison: 1 day・7 days・30 days
- For rent
- 255 units Comparison: 1 day・7 days・30 days
-
Kawasaki Market Trends
Active listings
- For sale
- 199 units Comparison: 1 day・7 days
- For rent
- 38 units Comparison: 1 day・7 days
-
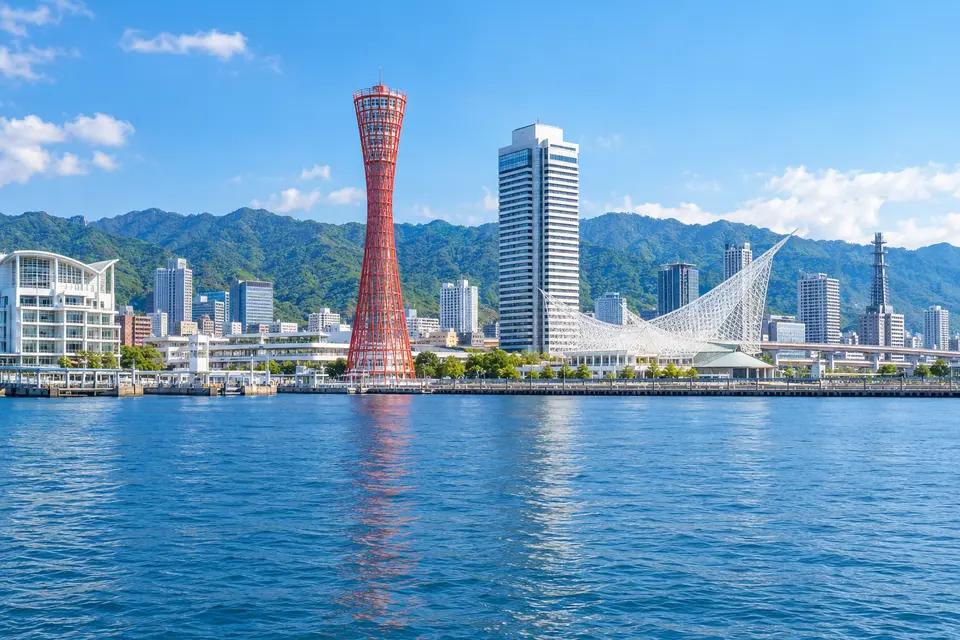
Kobe Market Trends
Active listings
- For sale
- 204 units Comparison: 1 day・7 days
- For rent
- 129 units Comparison: 1 day・7 days
-
Sendai Market Trends
Active listings
- For sale
- 86 units Comparison: 1 day・7 days
- For rent
- 61 units Comparison: 1 day・7 days
-
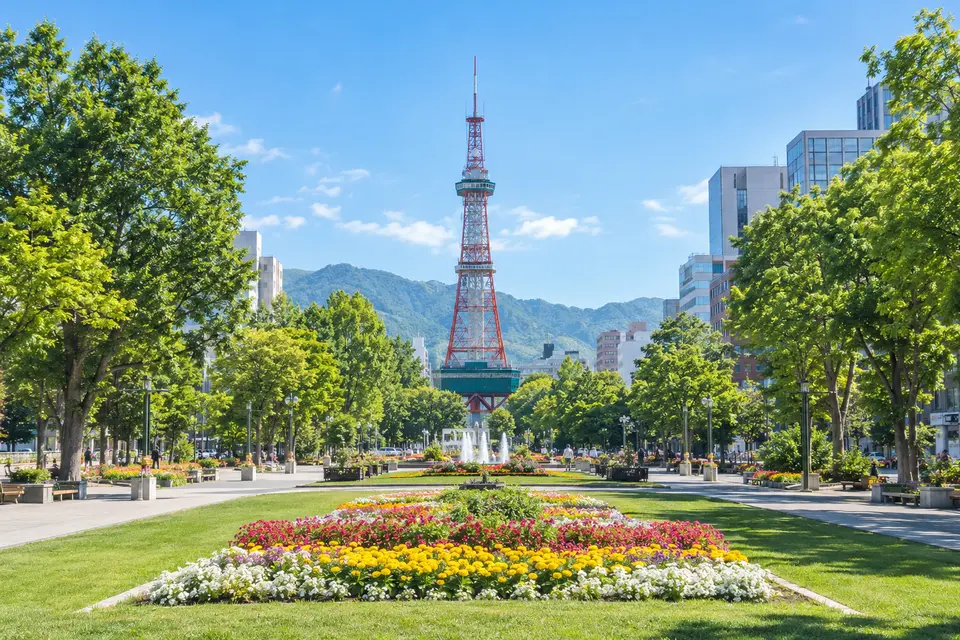
Sapporo Market Trends
Active listings
- For sale
- 96 units Comparison: 1 day・7 days
- For rent
- 257 units Comparison: 1 day・7 days
Card images are generated from each city’s characteristics and do not depict actual streetscapes or buildings.
Latest aggregation date: 2026-10-21(All areas finalized · confirmed areas 99/99)
Average Price per Tsubo for High-Rise Condominiums
For all published areas (Tokyo 23 Wards, Yokohama, Osaka, Nagoya, Fukuoka, Kawasaki, Kobe, Sendai, Sapporo), compare the 10 years through the latest complete year (2016〜2025).
Average price per tsubo for tower condominiums in Tokyo 23 Wards, Yokohama, Osaka, Nagoya, Fukuoka, Kawasaki, Kobe, Sendai, Sapporo
¥10,000/tsubo- Tokyo 23 Wards
- Yokohama
- Osaka
- Nagoya
- Fukuoka
- Kawasaki
- Kobe
- Sendai
- Sapporo
| Year | Tokyo 23 Wards | Yokohama | Osaka | Nagoya | Fukuoka | Kawasaki | Kobe | Sendai | Sapporo |
|---|---|---|---|---|---|---|---|---|---|
| 2016Year | 334.6 1,247 listings · 314 buildings |
301.8 133 listings · 42 buildings |
202.2 328 listings · 123 buildings |
173.6 38 listings · 17 buildings |
134.2 41 listings · 15 buildings |
251.1 90 listings · 31 buildings |
137.5 130 listings · 46 buildings |
155.1 53 listings · 16 buildings |
123.0 40 listings · 21 buildings |
| 2017Year | 346.8 1,268 listings · 310 buildings |
301.6 134 listings · 43 buildings |
203.9 338 listings · 119 buildings |
199.5 38 listings · 18 buildings |
157.5 49 listings · 20 buildings |
250.1 110 listings · 29 buildings |
161.9 119 listings · 43 buildings |
147.0 42 listings · 17 buildings |
141.4 42 listings · 22 buildings |
| 2018Year | 352.8 1,221 listings · 318 buildings |
280.8 107 listings · 42 buildings |
217.2 286 listings · 118 buildings |
187.4 45 listings · 23 buildings |
179.5 47 listings · 20 buildings |
261.6 83 listings · 27 buildings |
149.9 136 listings · 43 buildings |
151.7 39 listings · 23 buildings |
142.0 48 listings · 20 buildings |
| 2019Year | 366.5 1,324 listings · 338 buildings |
292.8 100 listings · 45 buildings |
217.7 392 listings · 130 buildings |
202.3 39 listings · 23 buildings |
181.2 34 listings · 17 buildings |
265.5 86 listings · 33 buildings |
128.0 147 listings · 44 buildings |
132.5 33 listings · 16 buildings |
162.6 72 listings · 21 buildings |
| 2020Year | 384.6 1,381 listings · 355 buildings |
306.3 123 listings · 44 buildings |
240.3 376 listings · 135 buildings |
221.2 43 listings · 24 buildings |
163.2 52 listings · 20 buildings |
269.1 70 listings · 26 buildings |
151.8 139 listings · 48 buildings |
141.6 54 listings · 24 buildings |
157.1 58 listings · 22 buildings |
| 2021Year | 404.7 1,445 listings · 348 buildings |
341.9 108 listings · 40 buildings |
244.3 456 listings · 155 buildings |
228.4 76 listings · 27 buildings |
187.0 55 listings · 27 buildings |
280.6 75 listings · 30 buildings |
172.0 159 listings · 50 buildings |
177.4 57 listings · 23 buildings |
183.7 90 listings · 23 buildings |
| 2022Year | 447.0 1,290 listings · 367 buildings |
364.8 124 listings · 40 buildings |
263.7 447 listings · 150 buildings |
242.7 65 listings · 29 buildings |
170.9 52 listings · 21 buildings |
315.9 65 listings · 28 buildings |
181.5 130 listings · 42 buildings |
192.8 44 listings · 21 buildings |
187.1 112 listings · 28 buildings |
| 2023Year | 500.3 1,249 listings · 357 buildings |
395.6 118 listings · 45 buildings |
276.2 437 listings · 163 buildings |
243.5 66 listings · 27 buildings |
197.7 48 listings · 23 buildings |
318.0 67 listings · 30 buildings |
208.6 134 listings · 46 buildings |
175.4 50 listings · 26 buildings |
177.4 50 listings · 24 buildings |
| 2024Year | 581.2 1,354 listings · 378 buildings |
461.1 157 listings · 48 buildings |
319.8 470 listings · 165 buildings |
255.0 86 listings · 35 buildings |
219.4 64 listings · 29 buildings |
346.8 74 listings · 30 buildings |
207.2 169 listings · 47 buildings |
198.9 75 listings · 26 buildings |
169.1 59 listings · 27 buildings |
| 2025Year | 673.0 1,247 listings · 370 buildings |
499.0 152 listings · 52 buildings |
370.2 486 listings · 168 buildings |
277.5 86 listings · 34 buildings |
224.7 67 listings · 25 buildings |
377.2 72 listings · 27 buildings |
240.0 135 listings · 50 buildings |
217.2 56 listings · 31 buildings |
201.4 80 listings · 32 buildings |
Ministry of Land, Infrastructure, Transport and TourismReal Estate Information LibraryPrepared by TOWERS.SELECT from Real Estate Transaction Price Information (XIT001). The price per square meter for each transaction was converted to price per tsubo, then the arithmetic mean was calculated with each transaction counted once. Closed-price data was excluded because it begins partway through the series. The lower line in each cell shows the number of transactions used and the number of buildings they matched. Because the anonymized data contains no building name or floor, these are reference transactions matching published buildings of at least 20 stories by municipality, neighborhood, construction year, and structure—not necessarily sales in the tower itself. Duplicate matches of one transaction to multiple buildings were removed. Figures are not adjusted for inflation.
How to Read These Figures
These figures aggregate active listings collected daily from listing portals; they are not transaction prices. Days when collection fails are excluded from both the history and comparison endpoints.
Comparison periods are added automatically when both the latest successful collection date and a successful date one period earlier are available.1 day allows a ±1Date、7 days allows a ±2Date、30 days allows a ±3Date、180 days allows a ±10Date、1 year allows a ±20Date difference in the baseline date.