
Sapporo, Chuo Ward, Minami3jonishi 9-chome
4 buildings have dedicated pages.
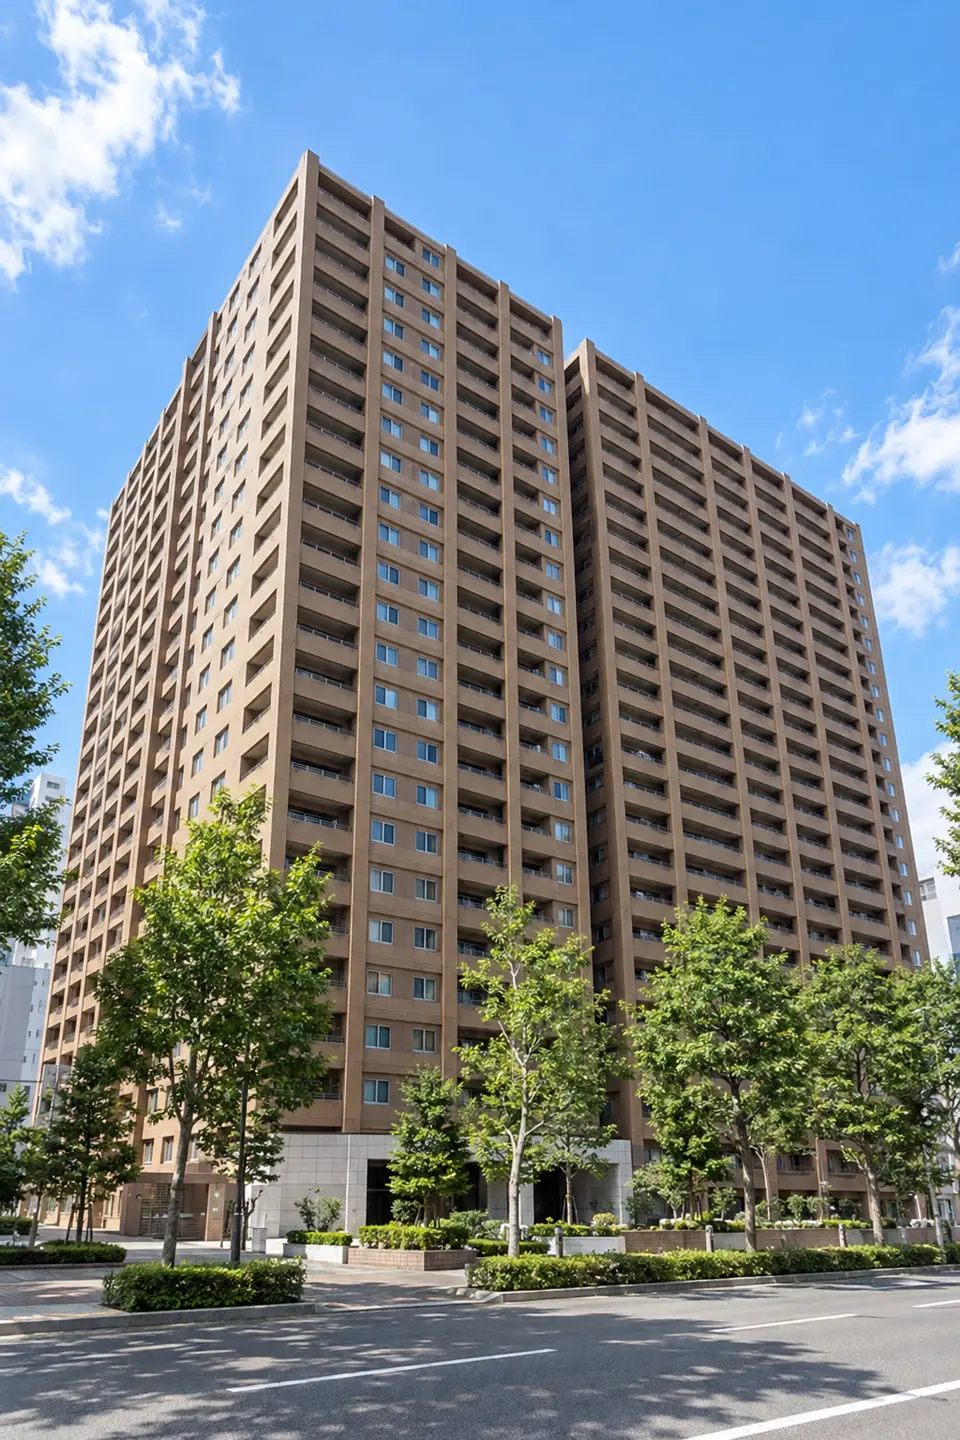
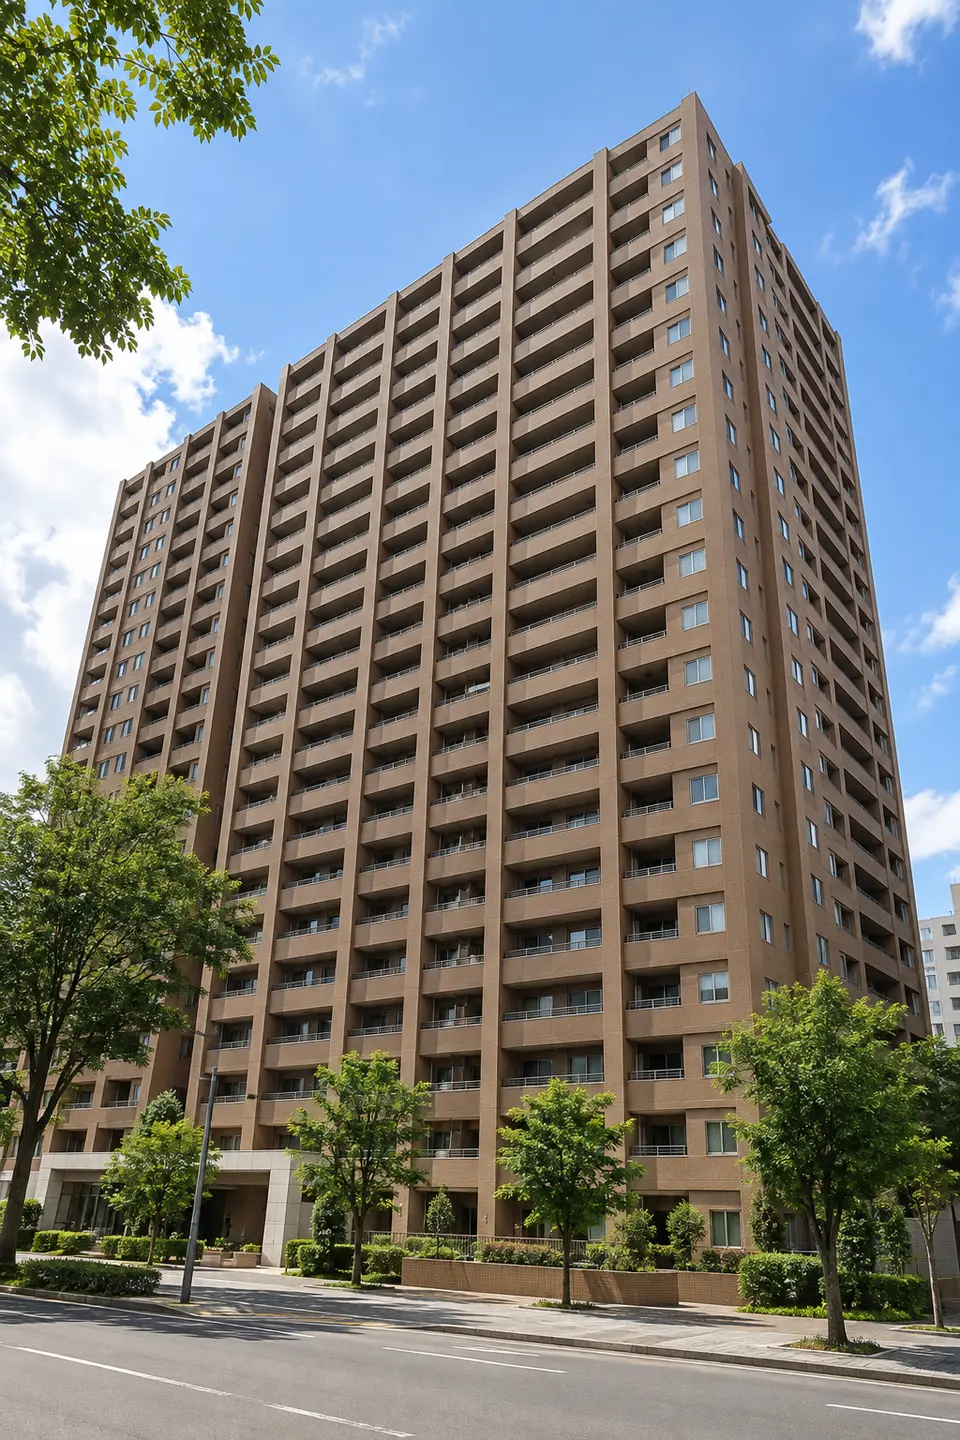
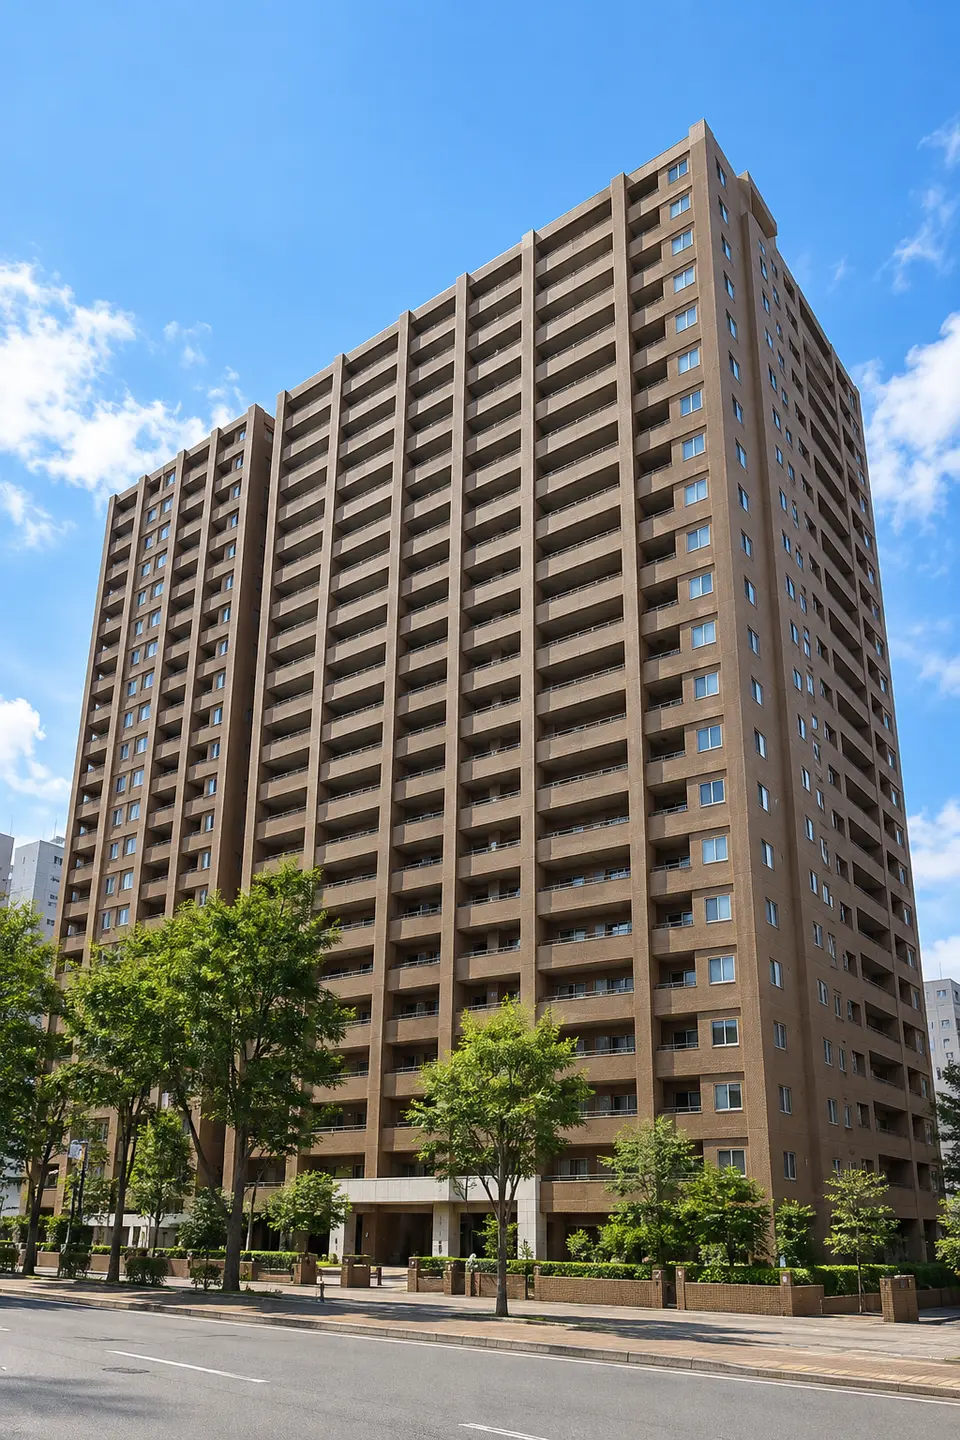
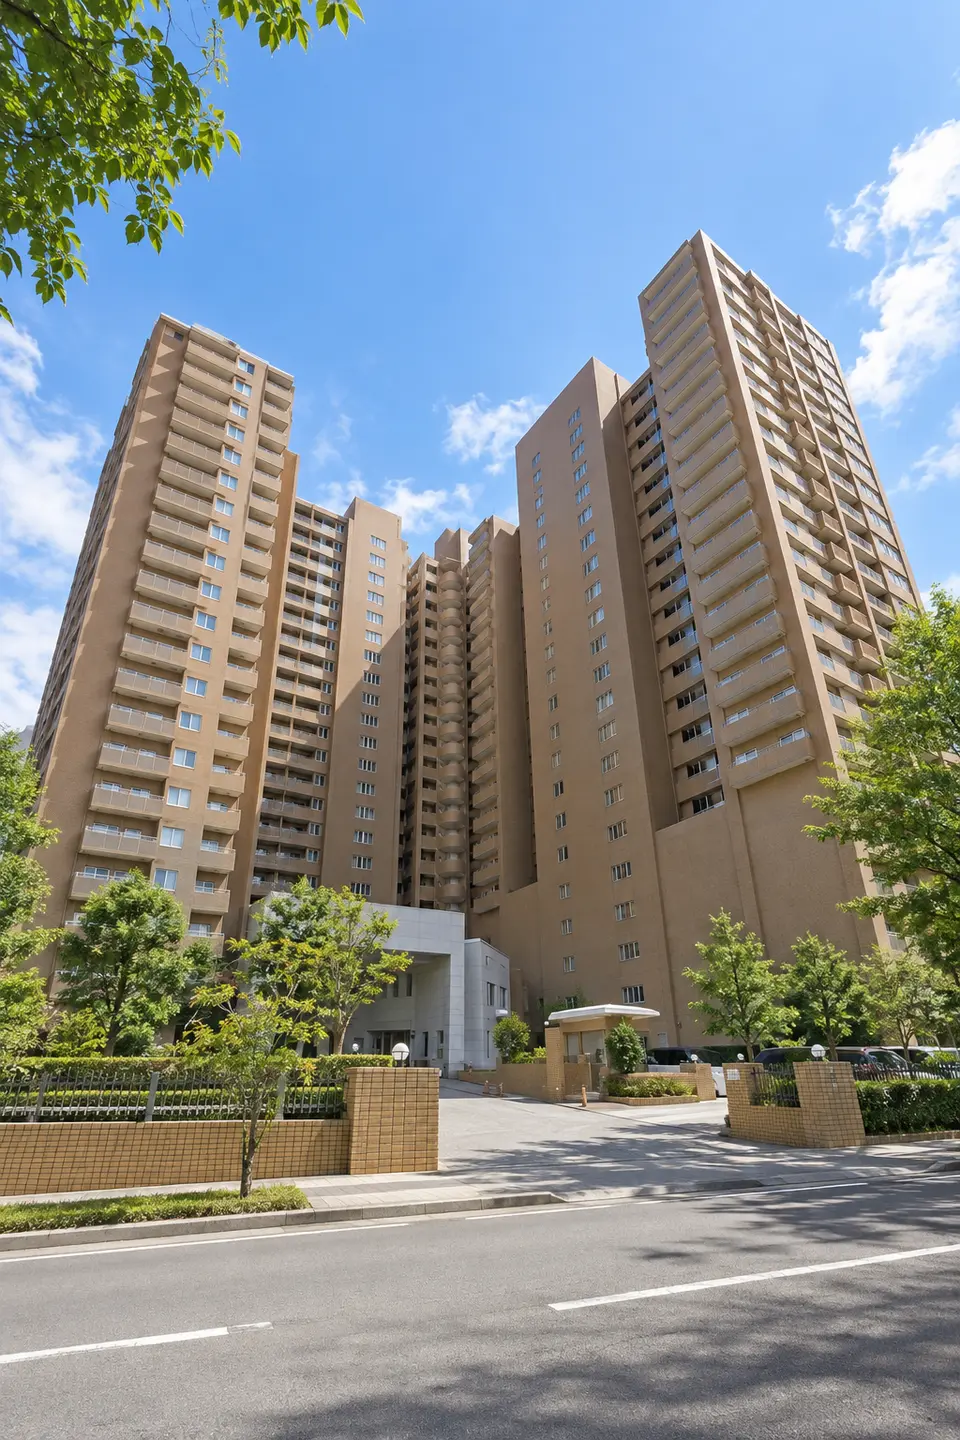
TOWERS.SELECT's neighborhood register of buildings with 20 or more stories in Sapporo, Chuo Ward, Minami3jonishi 9-chome.Compare the names, floor counts, completion years, total units, and sale and rental listing status of 4 published buildings.
Tower list
-
-
-
-
Building and Nearby Land Prices
| buildings | Completed | Number of Floors | Total units | Nearby Land Prices | Year-on-year |
|---|---|---|---|---|---|
| APA TOWERS SAPPORODORI KOEN WEST | 2005 | 20 floors | 319 units | 187.6 × ¥10,000/tsubo56.8 × ¥10,000/m²3 points · 184m to the nearest point | +8.0% |
| APA TOWERS SAPPORODORI KOEN SOUTH TO 1 GO | 2005 | 20 floors | 319 units | 187.6 × ¥10,000/tsubo56.8 × ¥10,000/m²3 points · 184m to the nearest point | +8.0% |
| APA TOWERS SAPPORODORI KOEN SOUTH TO 2 GO | 2005 | 20 floors | 319 units | 187.6 × ¥10,000/tsubo56.8 × ¥10,000/m²3 points · 184m to the nearest point | +8.0% |
| APA TOWERS SAPPORODORI KOEN CENTRAL | 2005 | 20 floors | 319 units | 187.6 × ¥10,000/tsubo56.8 × ¥10,000/m²3 points · 184m to the nearest point | +8.0% |
Nearby land value is an average of official land-price points around each building, weighted more heavily toward nearer points. These are point values, not the value of the building's land. “—” indicates a building with no nearby point data.
Nearby official land-price points(2026)
| Location | Use | Price | Year-on-year | 5-year annual average | To nearest building |
|---|---|---|---|---|---|
| 札幌中央北海道 札幌市中央区南3条西10丁目1002番4外 | Office | 249.6 × ¥10,000/tsubo75.5 × ¥10,000/m² | +8.6% | +8.8% | 184mReferenced by 12 buildings |
Points are selected by proximity to buildings in this neighborhood and may include points outside it. Year-on-year and five-year annual averages use prices for the same points rather than reselecting points each year.
Source: Created by TOWERS.SELECT using the Ministry of Land, Infrastructure, Transport and Tourism's National Land Numerical Information “Official Land Prices”