
Yokohama, Kanagawa Ward, Sakaecho
3 buildings have dedicated pages.
TOWERS.SELECT's neighborhood register of buildings with 20 or more stories in Yokohama, Kanagawa Ward, Sakaecho.Compare the names, floor counts, completion years, total units, and sale and rental listing status of 3 published buildings.
Tower list
-
-
-
Building and Nearby Land Prices
| buildings | Completed | Number of Floors | Total units | Nearby Land Prices | Year-on-year |
|---|---|---|---|---|---|
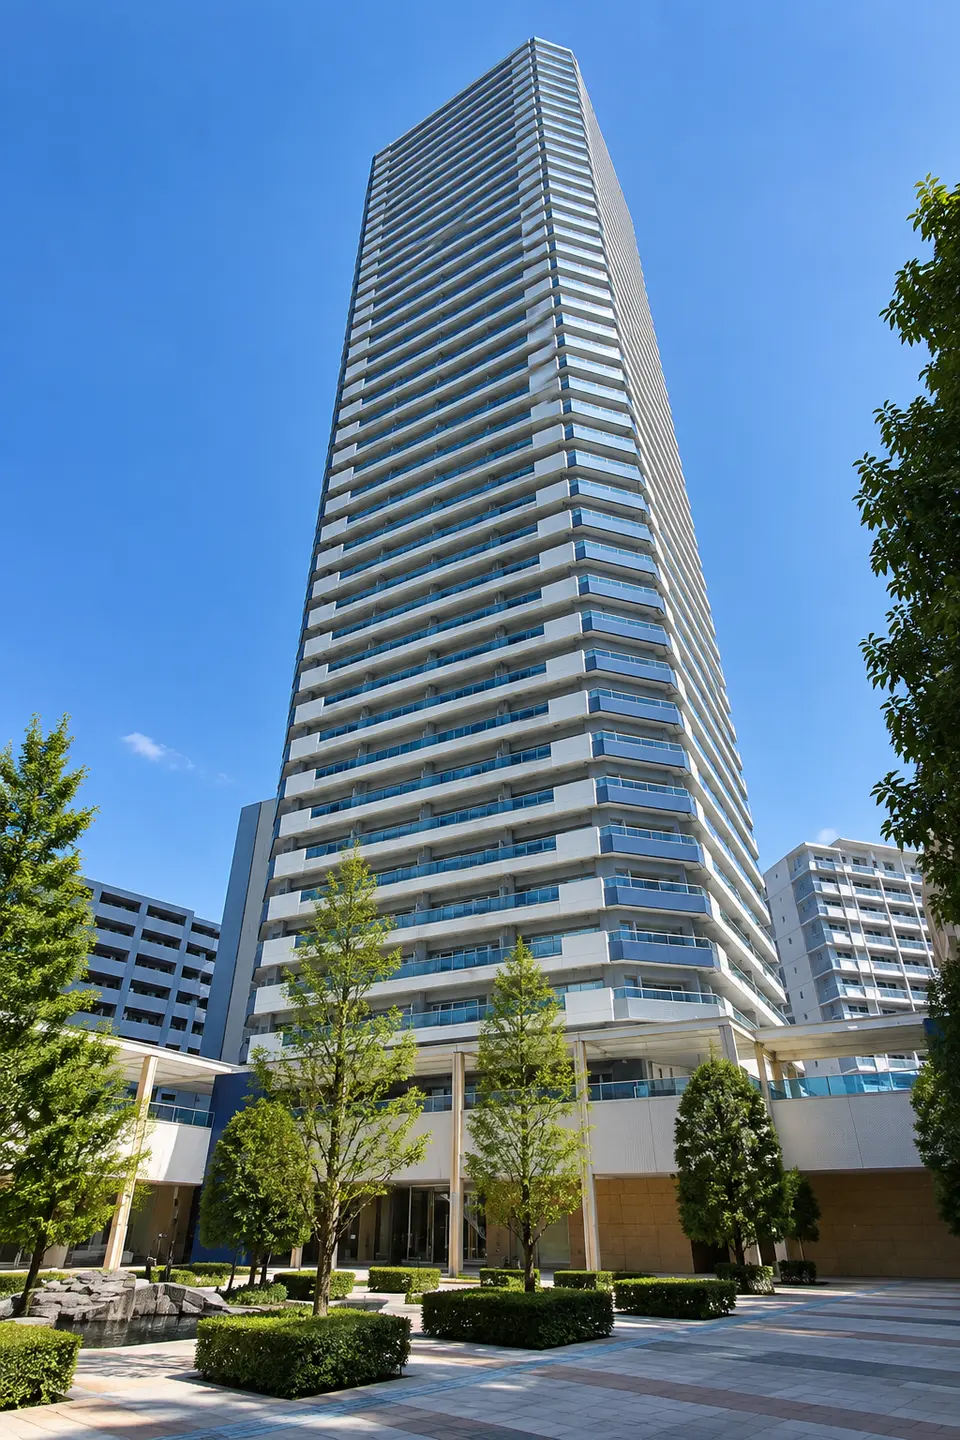
| THE YOKOHAMA TOWERS TOWER EAST | 2003 | 42 floors | 416 units | 359.7 × ¥10,000/tsubo108.8 × ¥10,000/m²3 points · 439m to the nearest point | +11.9% |
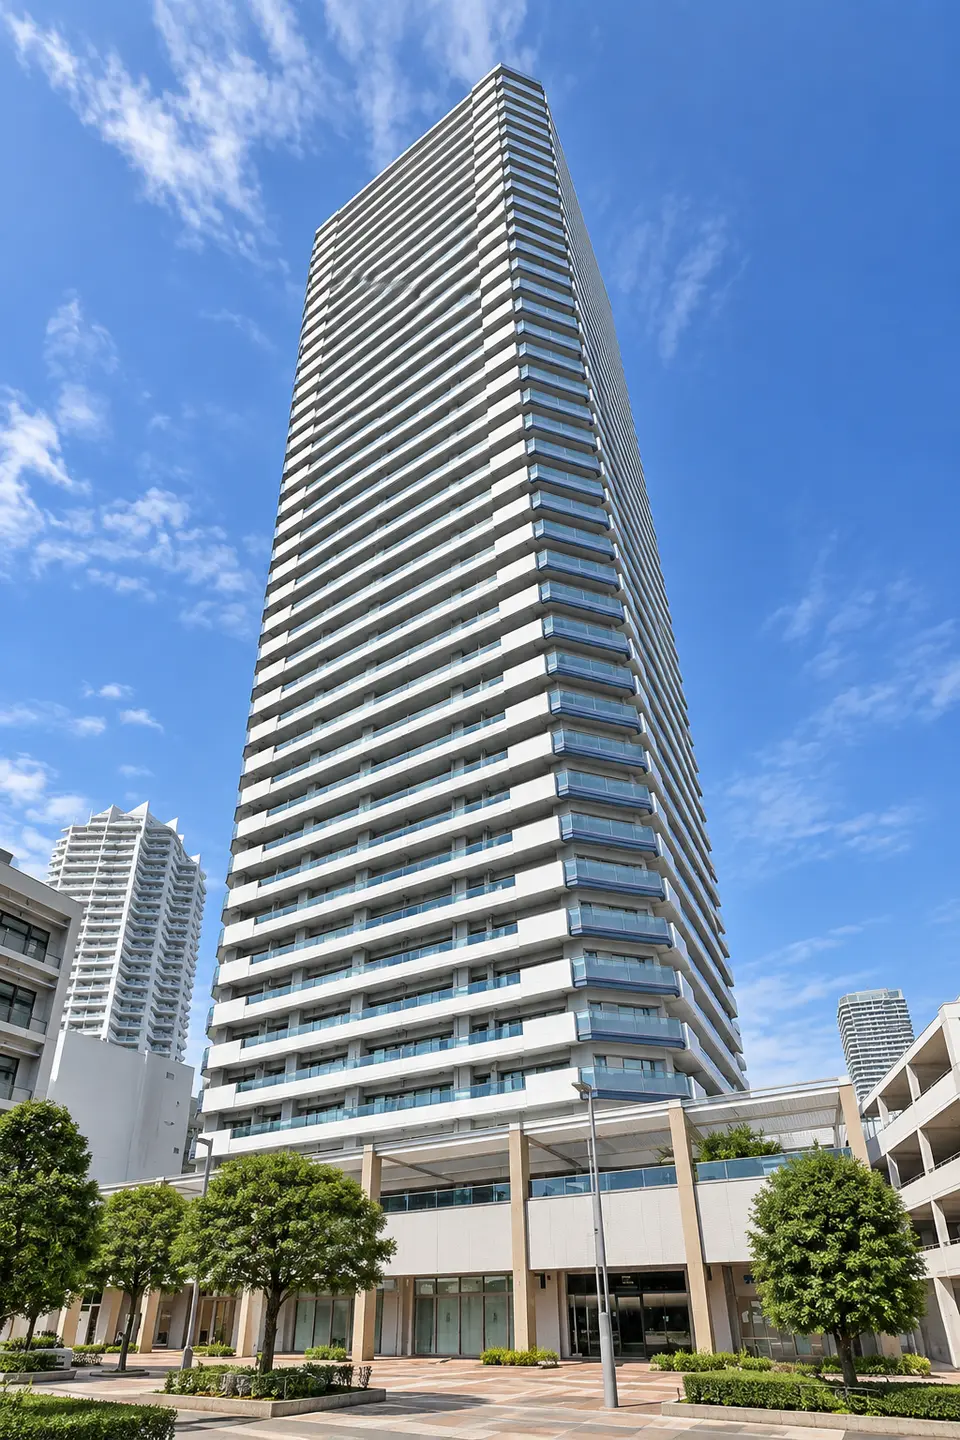
| THE YOKOHAMA TOWERS TOWER WEST | 2001 | 42 floors | 402 units | 1,535.0 × ¥10,000/tsubo464.3 × ¥10,000/m²3 points · 418m to the nearest point | +10.0% |
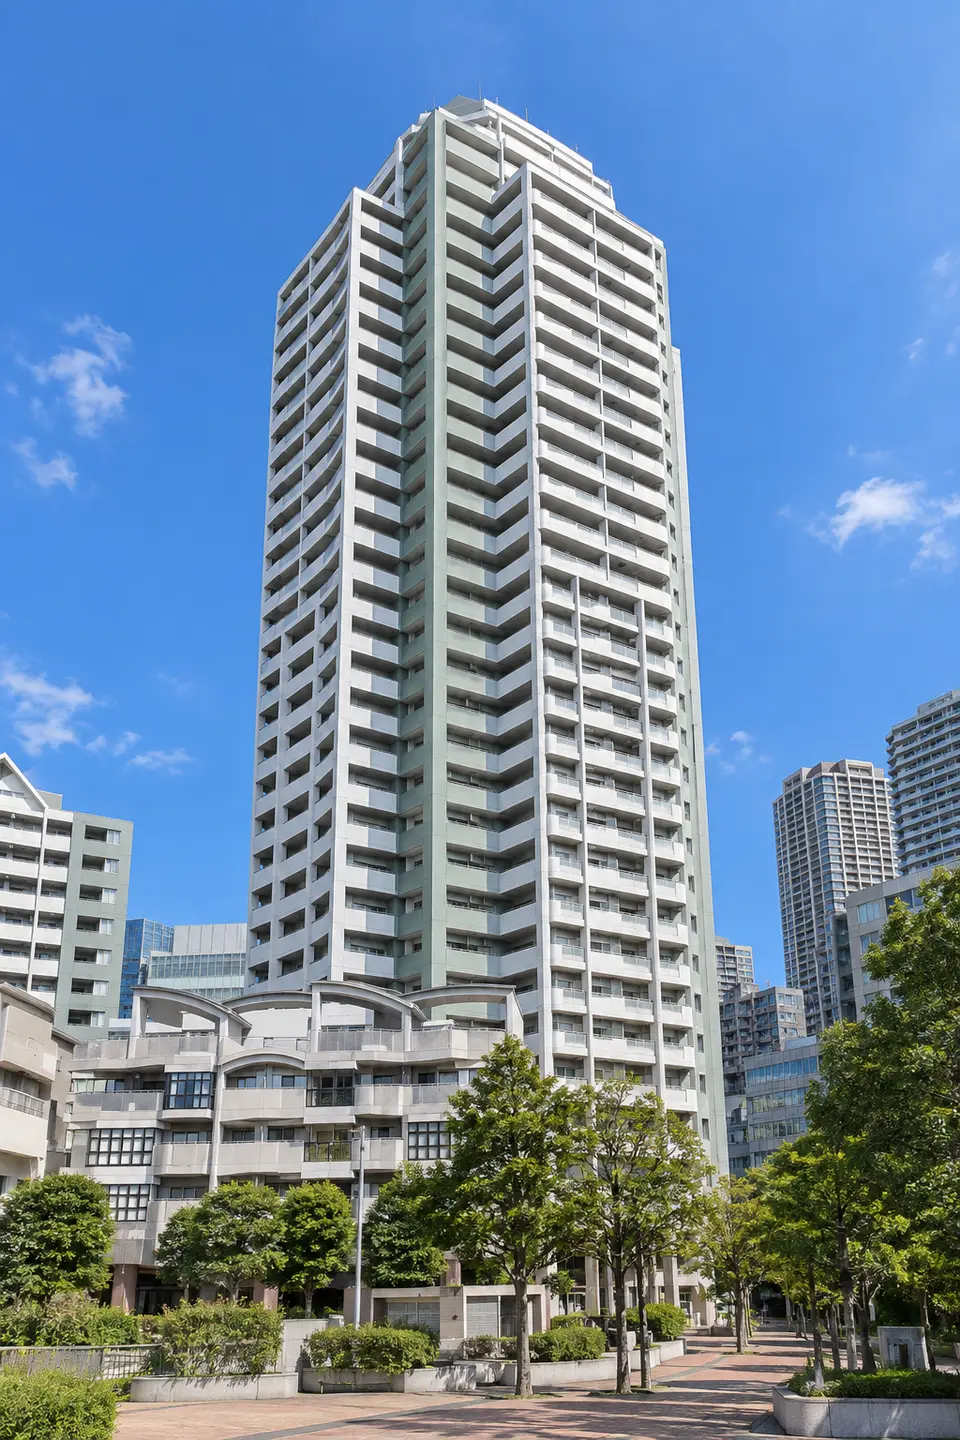
| YOKOHAMAPOTO SIDE ROAICHIBANKAN | 1994 | 33 floors | 281 units | 1,582.3 × ¥10,000/tsubo478.7 × ¥10,000/m²3 points · 303m to the nearest point | +10.6% |
Nearby land value is an average of official land-price points around each building, weighted more heavily toward nearer points. These are point values, not the value of the building's land. “—” indicates a building with no nearby point data.
Nearby official land-price points(2026)
| Location | Use | Price | Year-on-year | 5-year annual average | To nearest building |
|---|---|---|---|---|---|
| 横浜神奈川神奈川県 横浜市神奈川区幸ケ谷7番6 | Residential | 151.1 × ¥10,000/tsubo45.7 × ¥10,000/m² | +7.5% | +5.9% | 303mReferenced by 7 buildings |
| 横浜西神奈川県 横浜市西区南幸1丁目3番1 | Retail space | 5,652.9 × ¥10,000/tsubo1,710.0 × ¥10,000/m² | +1.2% | +1.9% | 677mReferenced by 2 buildings |
Points are selected by proximity to buildings in this neighborhood and may include points outside it. Year-on-year and five-year annual averages use prices for the same points rather than reselecting points each year.
Source: Created by TOWERS.SELECT using the Ministry of Land, Infrastructure, Transport and Tourism's National Land Numerical Information “Official Land Prices”