
Tokyo 23 Wards, Minato Ward, Konan 4-chome
6 buildings have dedicated pages.
TOWERS.SELECT's neighborhood register of buildings with 20 or more stories in Tokyo 23 Wards, Minato Ward, Konan 4-chome.Compare the names, floor counts, completion years, total units, and sale and rental listing status of 6 published buildings.
Tower list
-
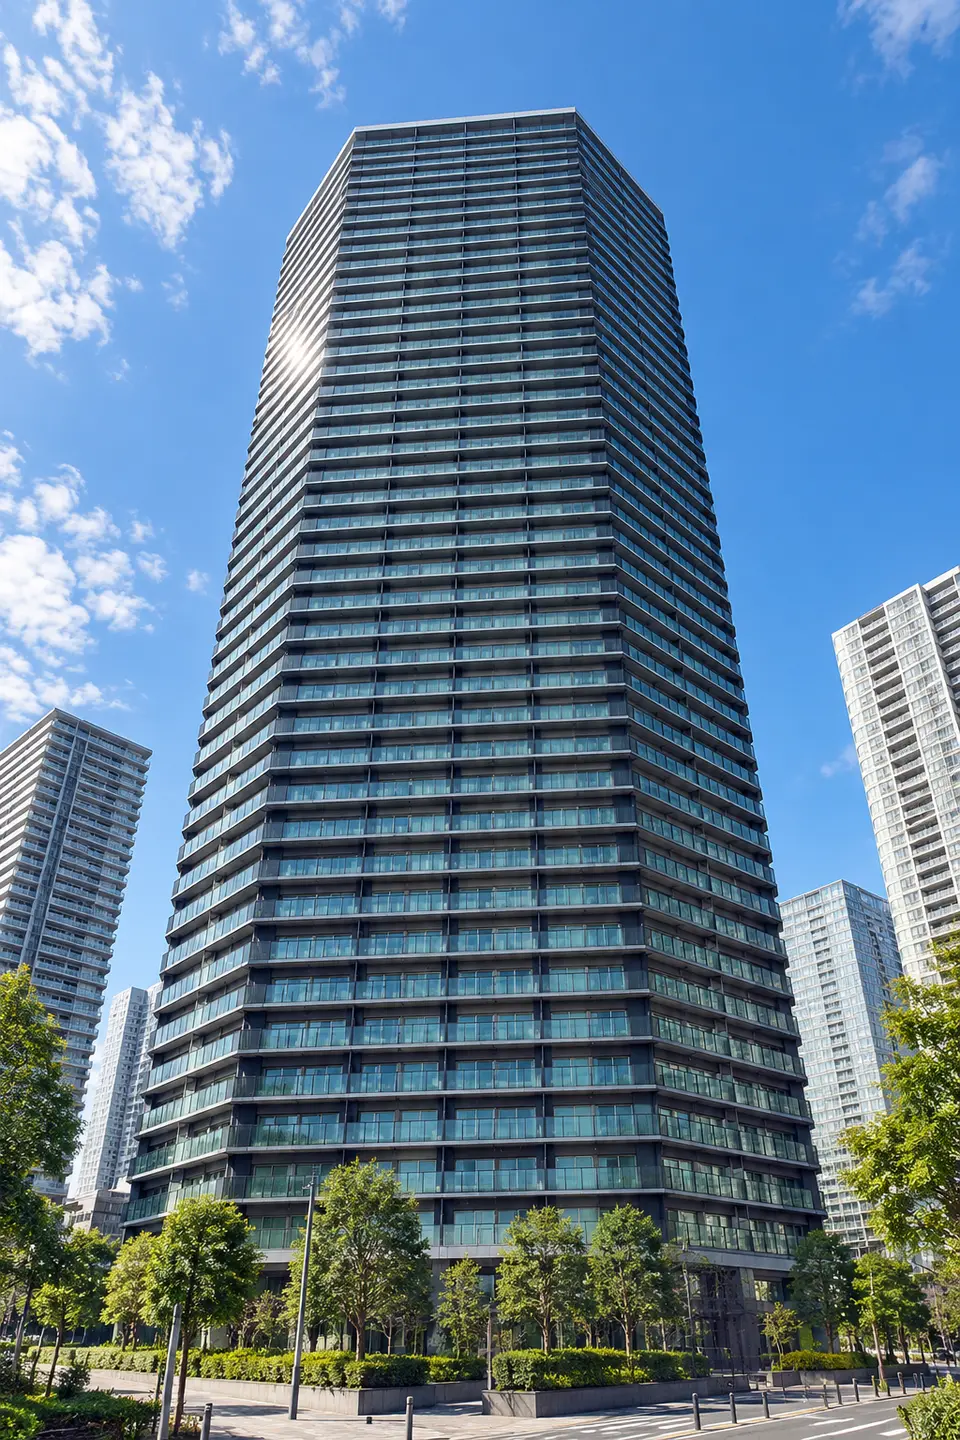
-
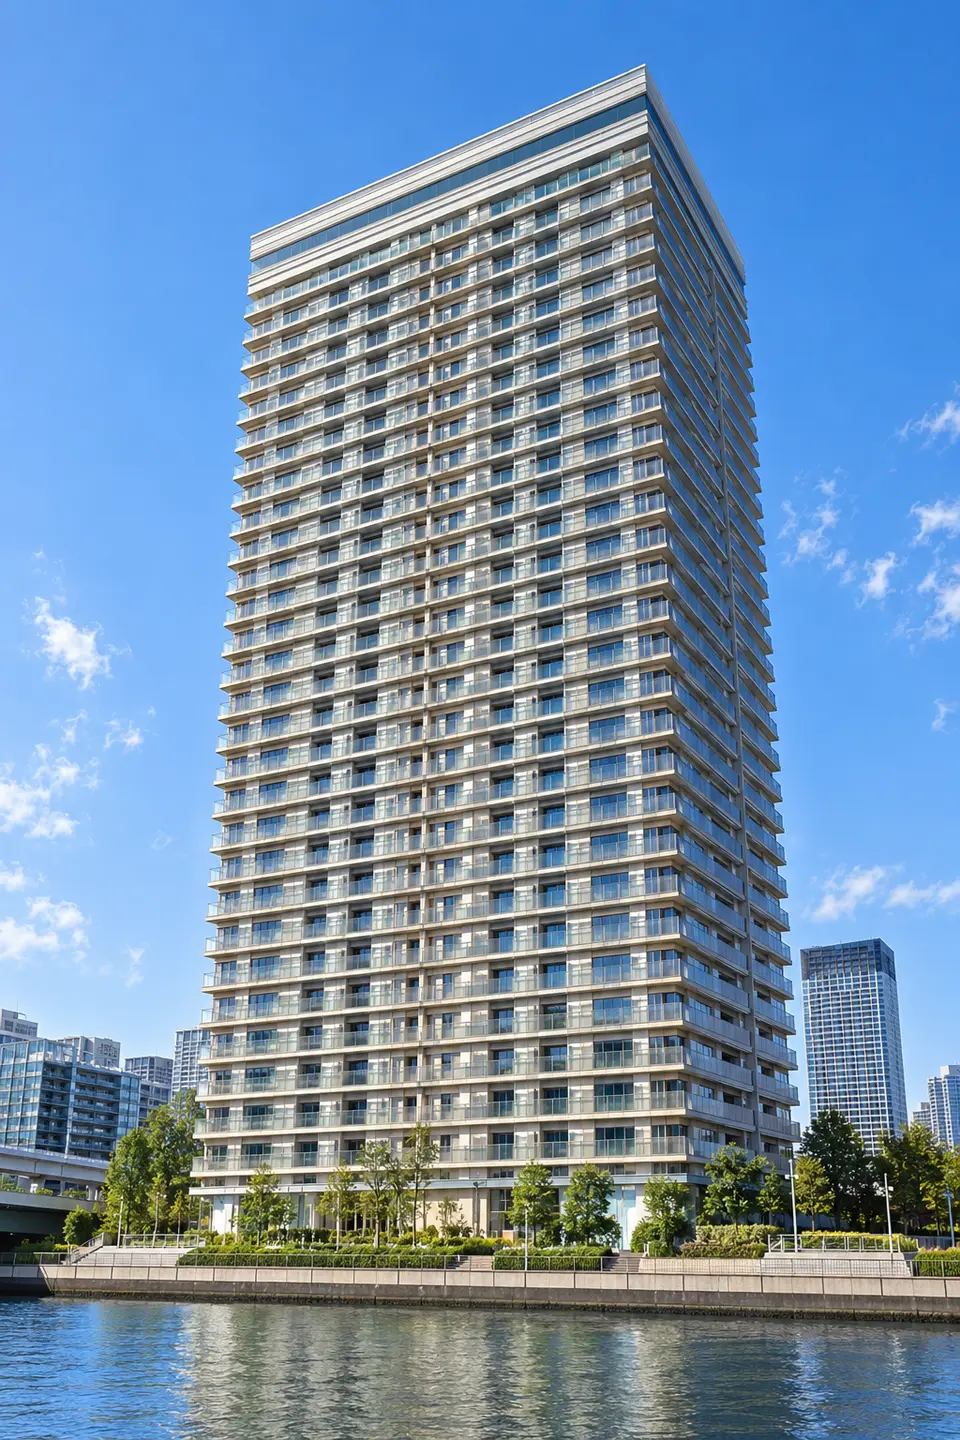
-
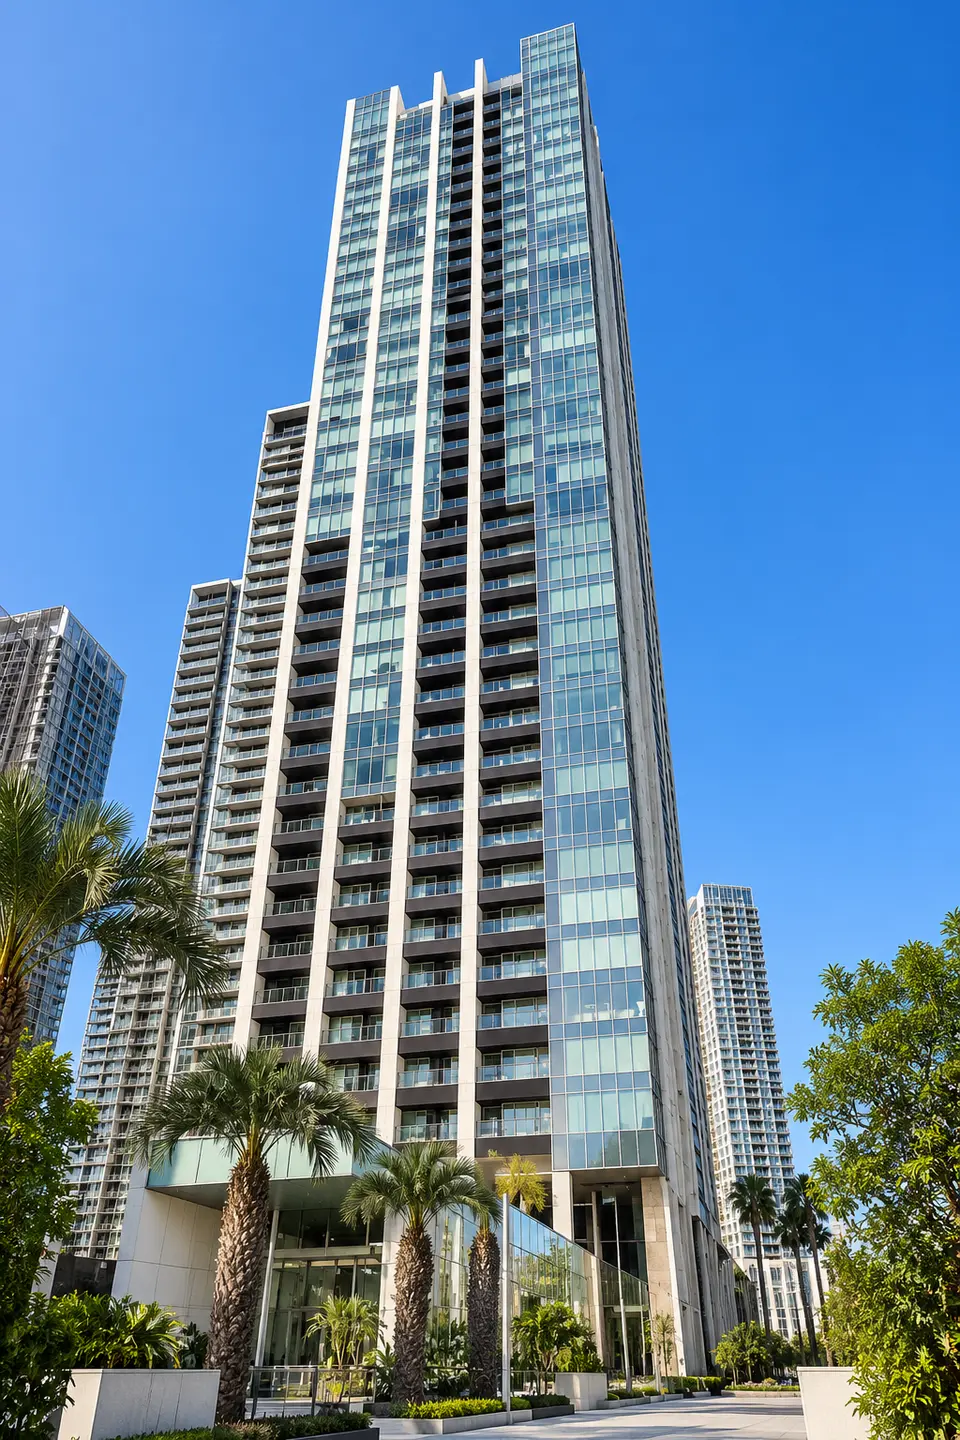
-
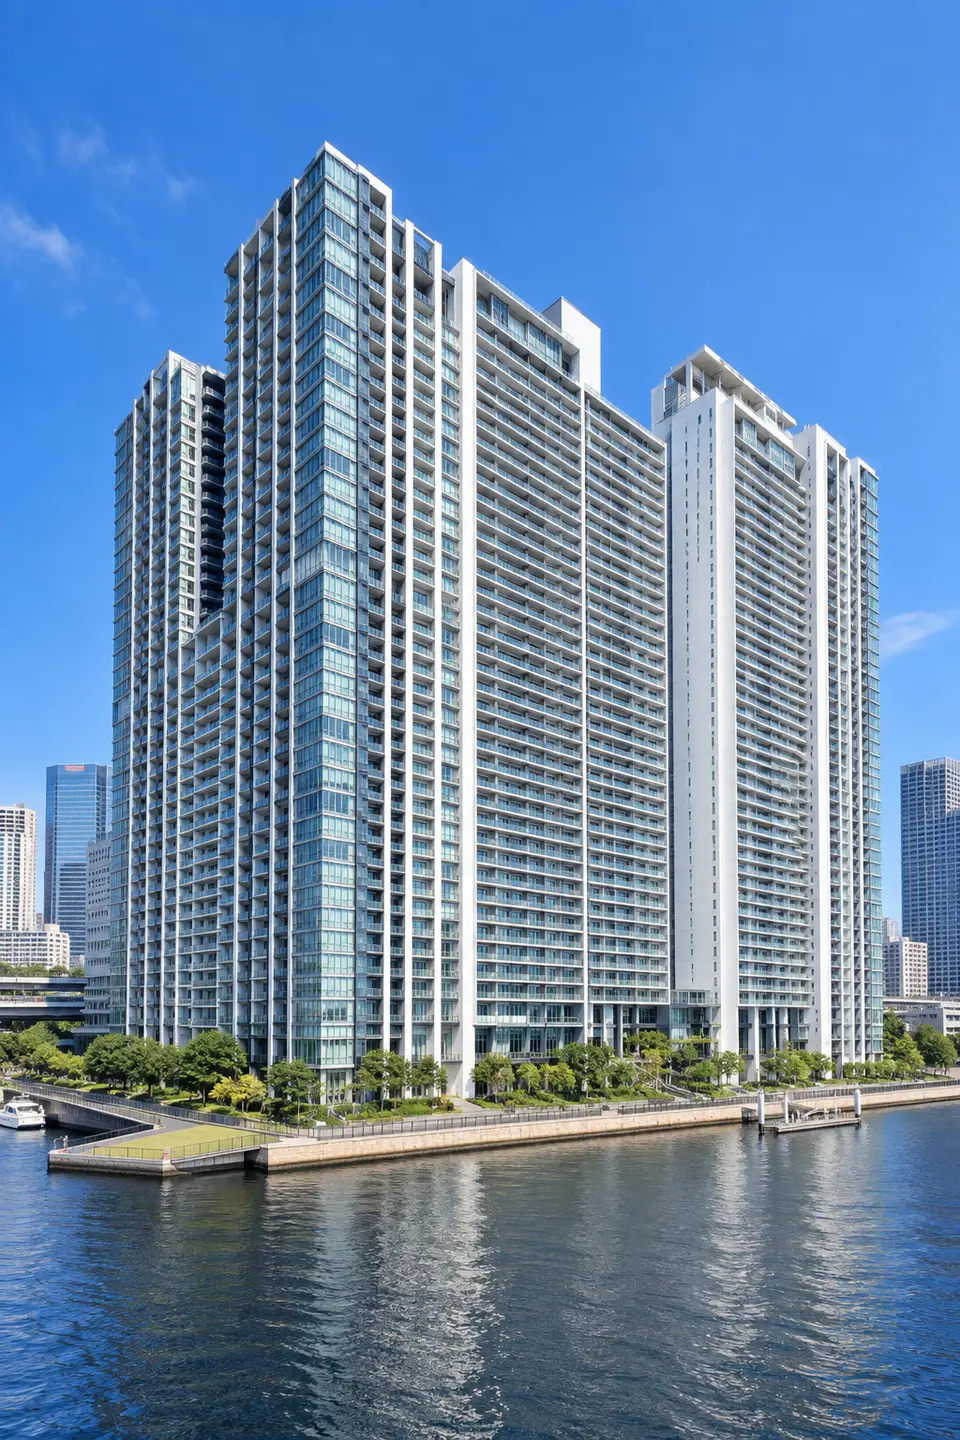
-
-
Building and Nearby Land Prices
| buildings | Completed | Number of Floors | Total units | Nearby Land Prices | Year-on-year |
|---|---|---|---|---|---|
| CITY TOWER SHINAGAWA | 2008 | 43 floors | 843 units | 1,552.1 × ¥10,000/tsubo469.5 × ¥10,000/m²3 points · 155m to the nearest point | +18.8% |
| FURONTIA RESIDENCE THE TOWER SHINAGAWA | 2003 | 24 floors | 305 units | 1,849.8 × ¥10,000/tsubo559.6 × ¥10,000/m²3 points · 228m to the nearest point | +17.6% |
| WARUDO CITY TOWERS AKUA TOWER | 2005 | 42 floors | 1,038 units | 1,241.4 × ¥10,000/tsubo375.5 × ¥10,000/m²3 points · 622m to the nearest point | +18.8% |
| WARUDO CITY TOWERS KYAPITARU TOWER | 2006 | 42 floors | 593 units | 1,259.4 × ¥10,000/tsubo381.0 × ¥10,000/m²3 points · 528m to the nearest point | +19.0% |
| WARUDO CITY TOWERS BURIZU TOWER | 2006 | 42 floors | 459 units | 1,236.1 × ¥10,000/tsubo373.9 × ¥10,000/m²3 points · 552m to the nearest point | +19.1% |
| TOKYO SHI SOUTH BURANFARE | 2004 | 36 floors | 373 units | 1,196.2 × ¥10,000/tsubo361.8 × ¥10,000/m²3 points · 338m to the nearest point | +19.8% |
Nearby land value is an average of official land-price points around each building, weighted more heavily toward nearer points. These are point values, not the value of the building's land. “—” indicates a building with no nearby point data.
Nearby official land-price points(2026)
| Location | Use | Price | Year-on-year | 5-year annual average | To nearest building |
|---|---|---|---|---|---|
| 000-019 | 000 | 747.1 × ¥10,000/tsubo226.0 × ¥10,000/m² | +22.2% | +12.8% | 155mReferenced by 6 buildings |
| 005-024 | 005 | 2,515.7 × ¥10,000/tsubo761.0 × ¥10,000/m² | +17.1% | +7.7% | 412mReferenced by 6 buildings |
| 005-025 | 005 | 717.4 × ¥10,000/tsubo217.0 × ¥10,000/m² | +16.7% | +8.4% | 650mReferenced by 4 buildings |
| 005-026 | 005 | 4,165.3 × ¥10,000/tsubo1,260.0 × ¥10,000/m² | +4.1% | +2.6% | 719mReferenced by 2 buildings |
Points are selected by proximity to buildings in this neighborhood and may include points outside it. Year-on-year and five-year annual averages use prices for the same points rather than reselecting points each year.
Source: Created by TOWERS.SELECT using the Ministry of Land, Infrastructure, Transport and Tourism's National Land Numerical Information “Official Land Prices”