
Tokyo 23 Wards, Setagaya Ward, Tamagawa 1-chome
3 buildings have dedicated pages.
TOWERS.SELECT's neighborhood register of buildings with 20 or more stories in Tokyo 23 Wards, Setagaya Ward, Tamagawa 1-chome.Compare the names, floor counts, completion years, total units, and sale and rental listing status of 3 published buildings.
Tower list
-
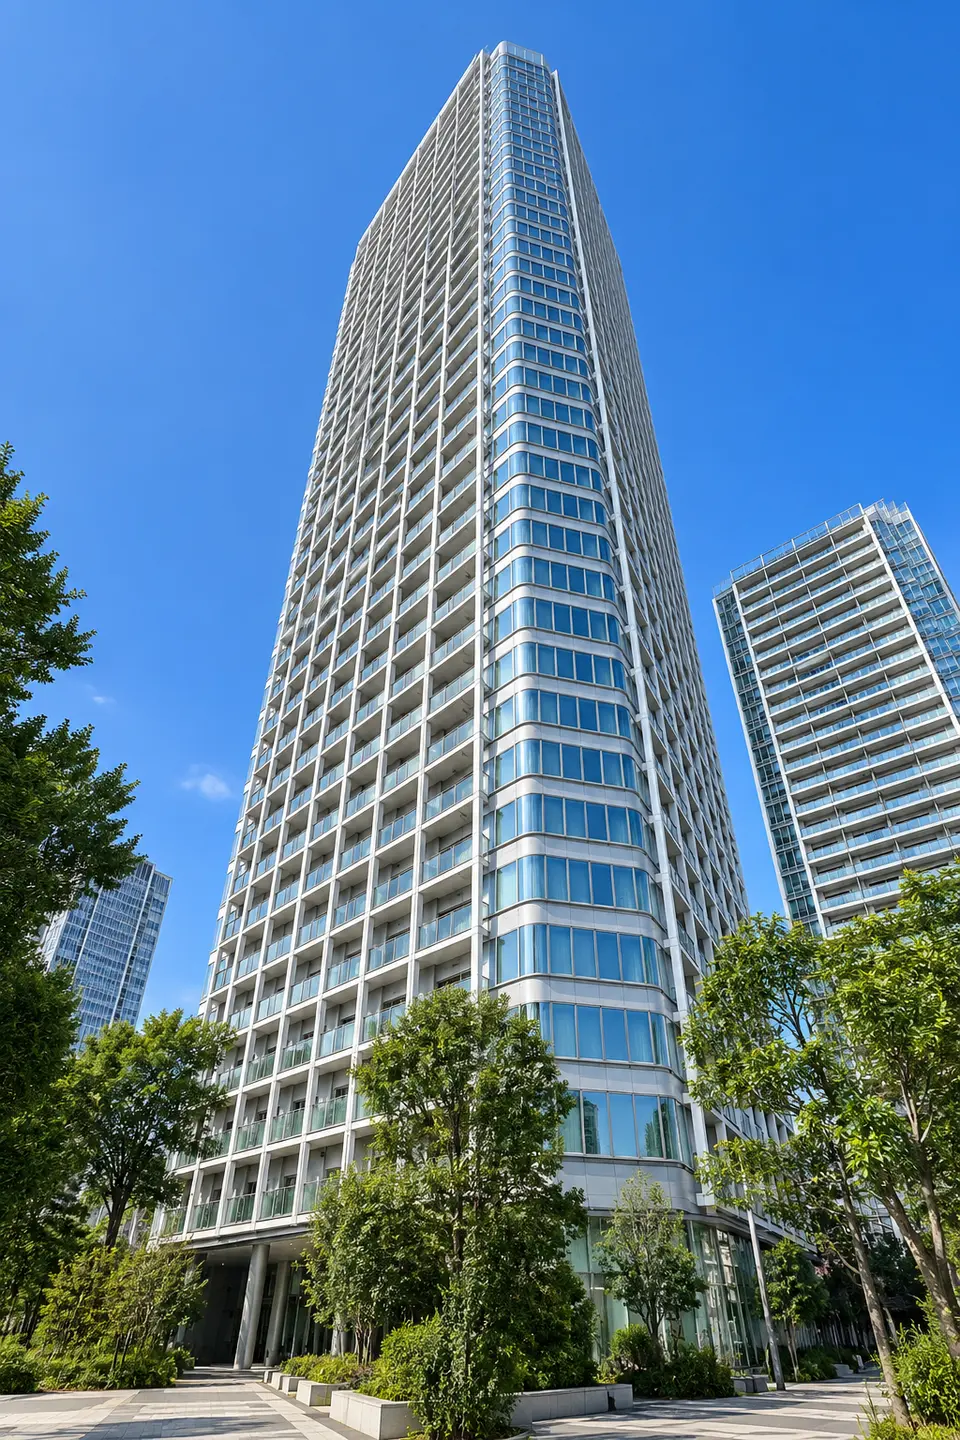
-
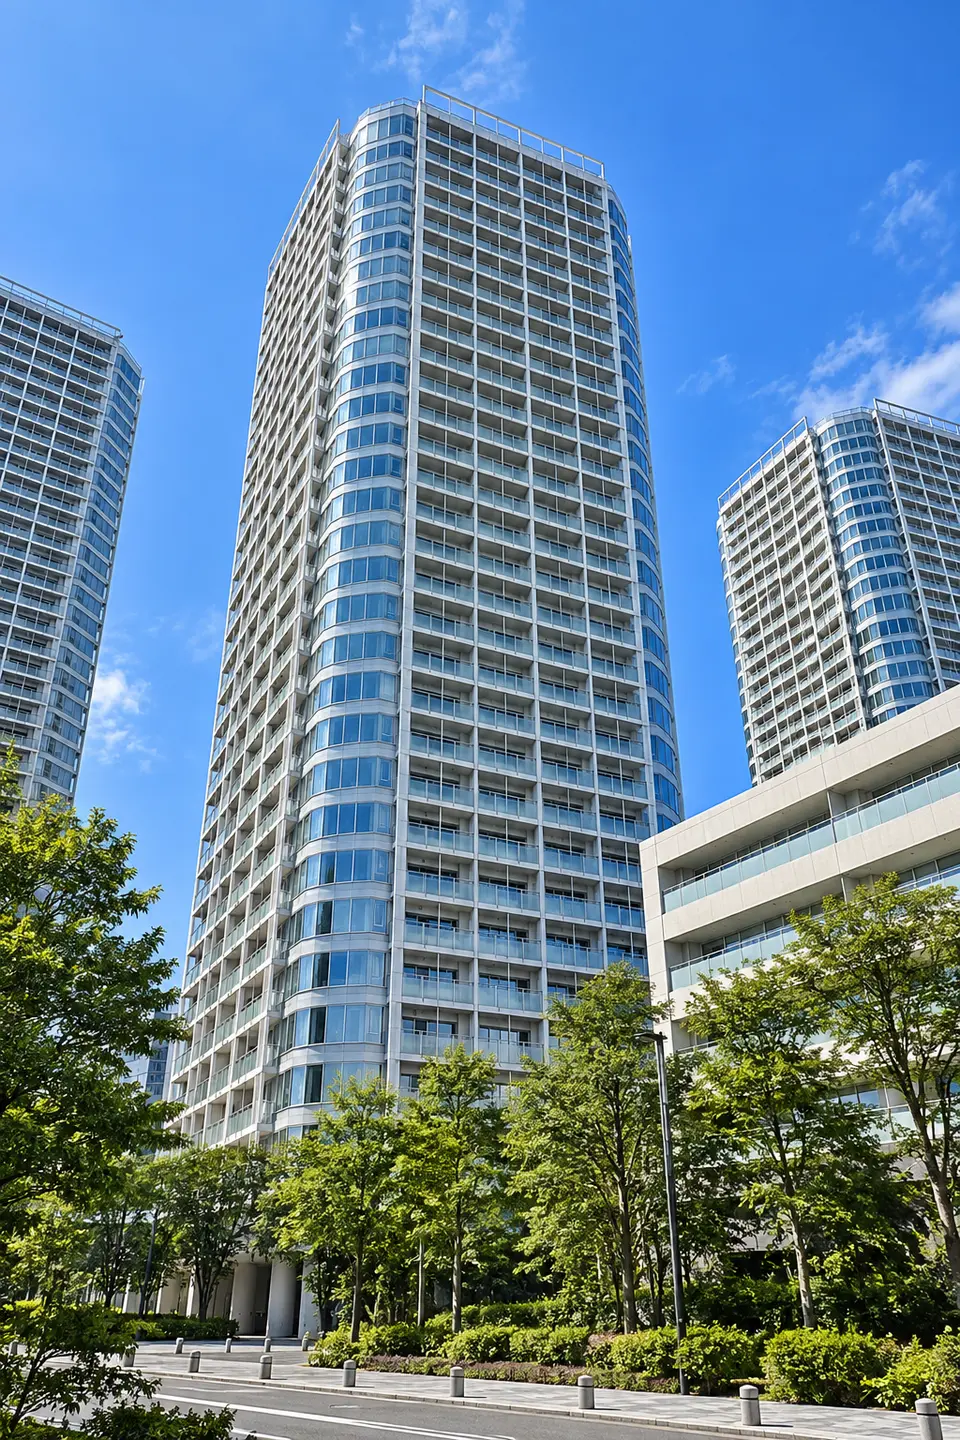
-
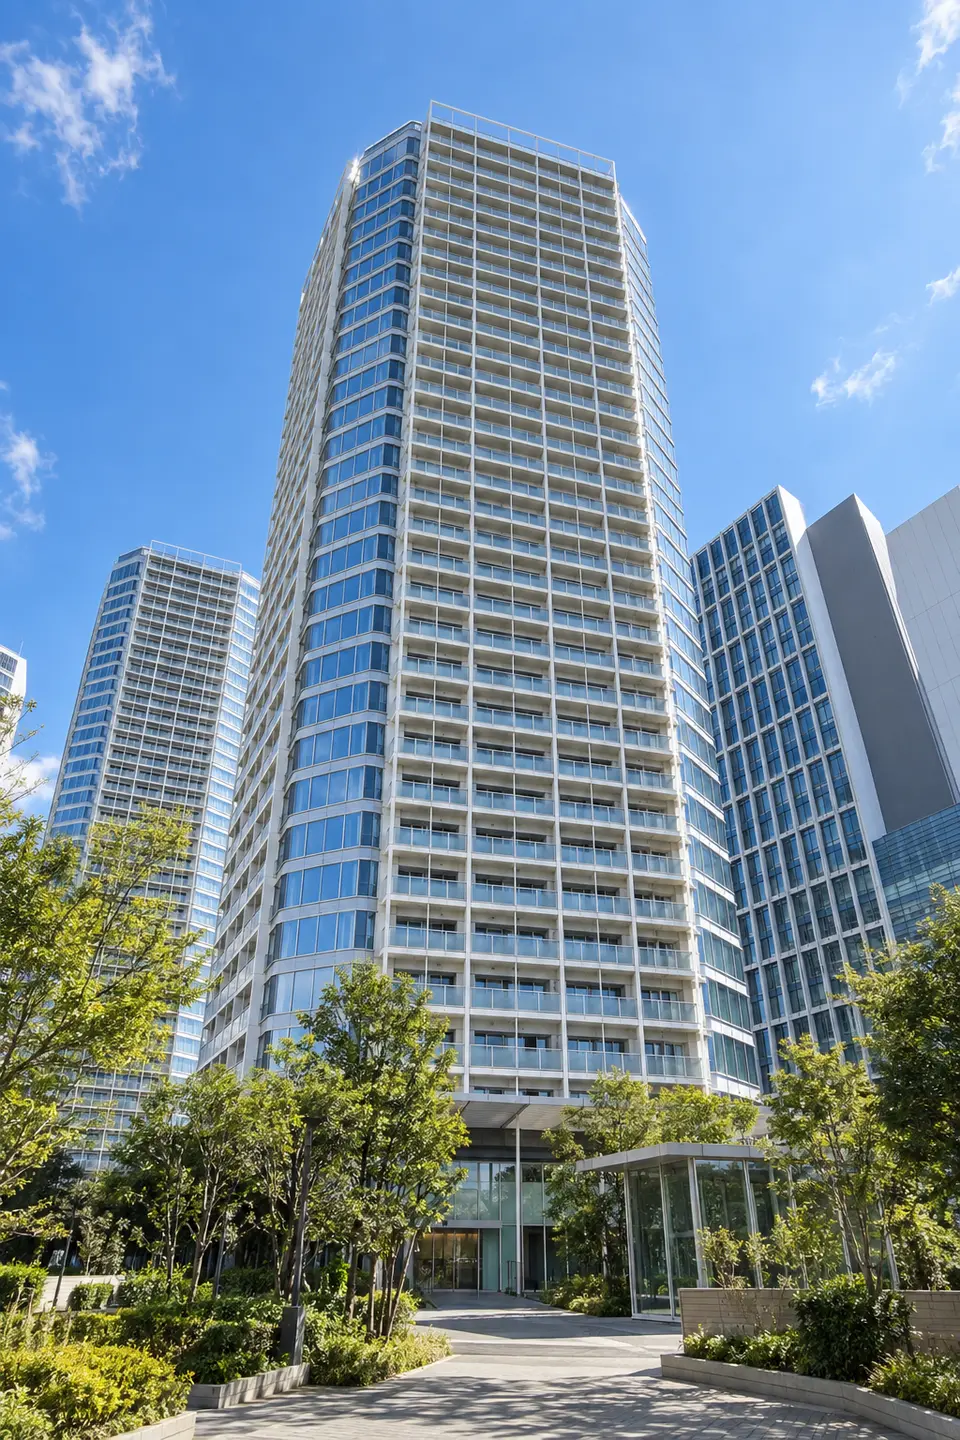
Building and Nearby Land Prices
| buildings | Completed | Number of Floors | Total units | Nearby Land Prices | Year-on-year |
|---|---|---|---|---|---|
| FUTAKOTAMAGAWARAIZU TOWER AND RESIDENCE TOWER EAST | 2010 | 42 floors | 395 units | 310.1 × ¥10,000/tsubo93.8 × ¥10,000/m²3 points · 219m to the nearest point | +7.3% |
| FUTAKOTAMAGAWARAIZU TOWER AND RESIDENCE TOWER WEST | 2010 | 28 floors | 283 units | 386.0 × ¥10,000/tsubo116.8 × ¥10,000/m²3 points · 215m to the nearest point | +8.3% |
| FUTAKOTAMAGAWARAIZU TOWER AND RESIDENCE TOWER CENTRAL | 2010 | 28 floors | 292 units | 314.5 × ¥10,000/tsubo95.1 × ¥10,000/m²3 points · 155m to the nearest point | +7.4% |
Nearby land value is an average of official land-price points around each building, weighted more heavily toward nearer points. These are point values, not the value of the building's land. “—” indicates a building with no nearby point data.
Nearby official land-price points(2026)
| Location | Use | Price | Year-on-year | 5-year annual average | To nearest building |
|---|---|---|---|---|---|
| 000-108 | 000 | 333.9 × ¥10,000/tsubo101.0 × ¥10,000/m² | +8.1% | +4.6% | 155mReferenced by 3 buildings |
| 000-095 | 000 | 287.9 × ¥10,000/tsubo87.1 × ¥10,000/m² | +6.2% | +3.6% | 605mReferenced by 3 buildings |
| 005-020 | 005 | 634.7 × ¥10,000/tsubo192.0 × ¥10,000/m² | +11.0% | +6.2% | 615mReferenced by 1 buildings |
| 000-074 | 000 | 259.5 × ¥10,000/tsubo78.5 × ¥10,000/m² | +5.8% | +3.0% | 658mReferenced by 2 buildings |
Points are selected by proximity to buildings in this neighborhood and may include points outside it. Year-on-year and five-year annual averages use prices for the same points rather than reselecting points each year.
Source: Created by TOWERS.SELECT using the Ministry of Land, Infrastructure, Transport and Tourism's National Land Numerical Information “Official Land Prices”