
Tokyo 23 Wards, Shinjuku Ward, Nishishinjuku 5-chome
4 buildings have dedicated pages.
TOWERS.SELECT's neighborhood register of buildings with 20 or more stories in Tokyo 23 Wards, Shinjuku Ward, Nishishinjuku 5-chome.Compare the names, floor counts, completion years, total units, and sale and rental listing status of 4 published buildings.
Tower list
-
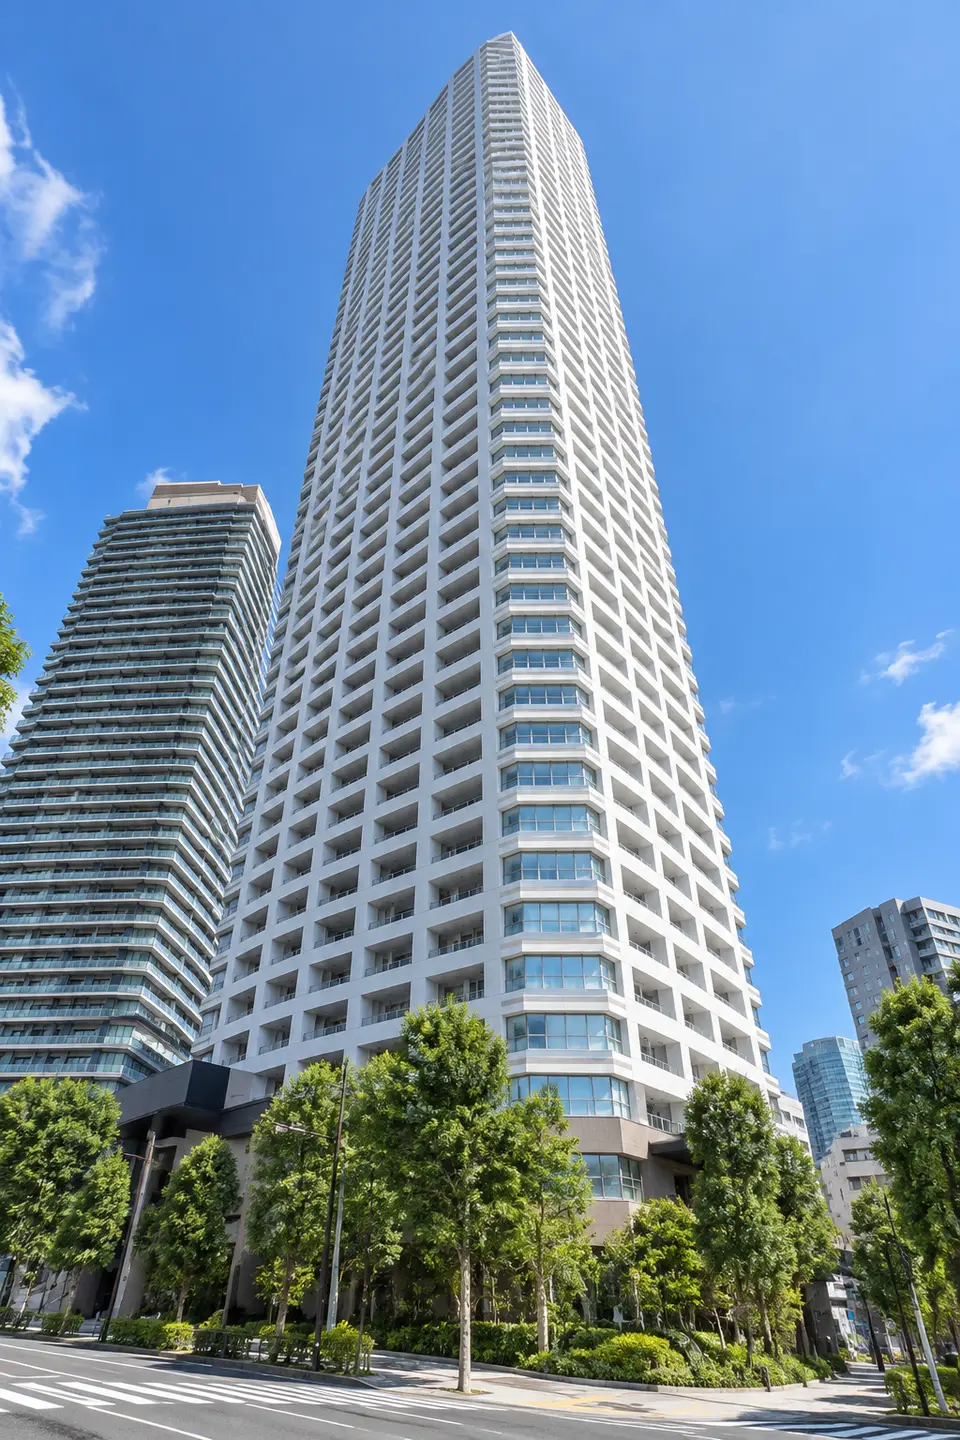
-
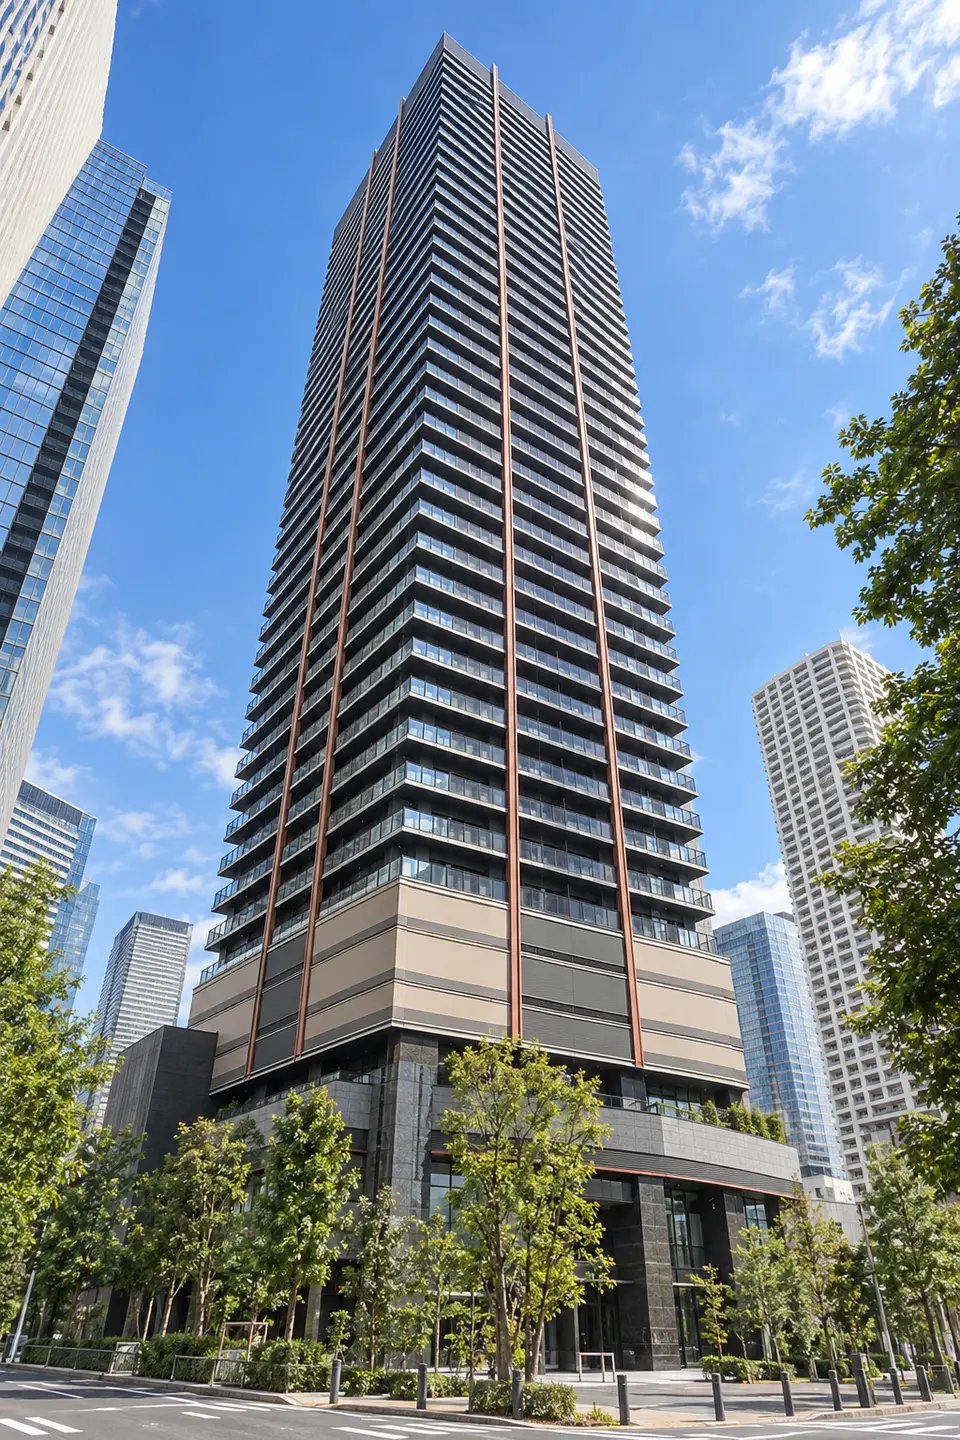
-
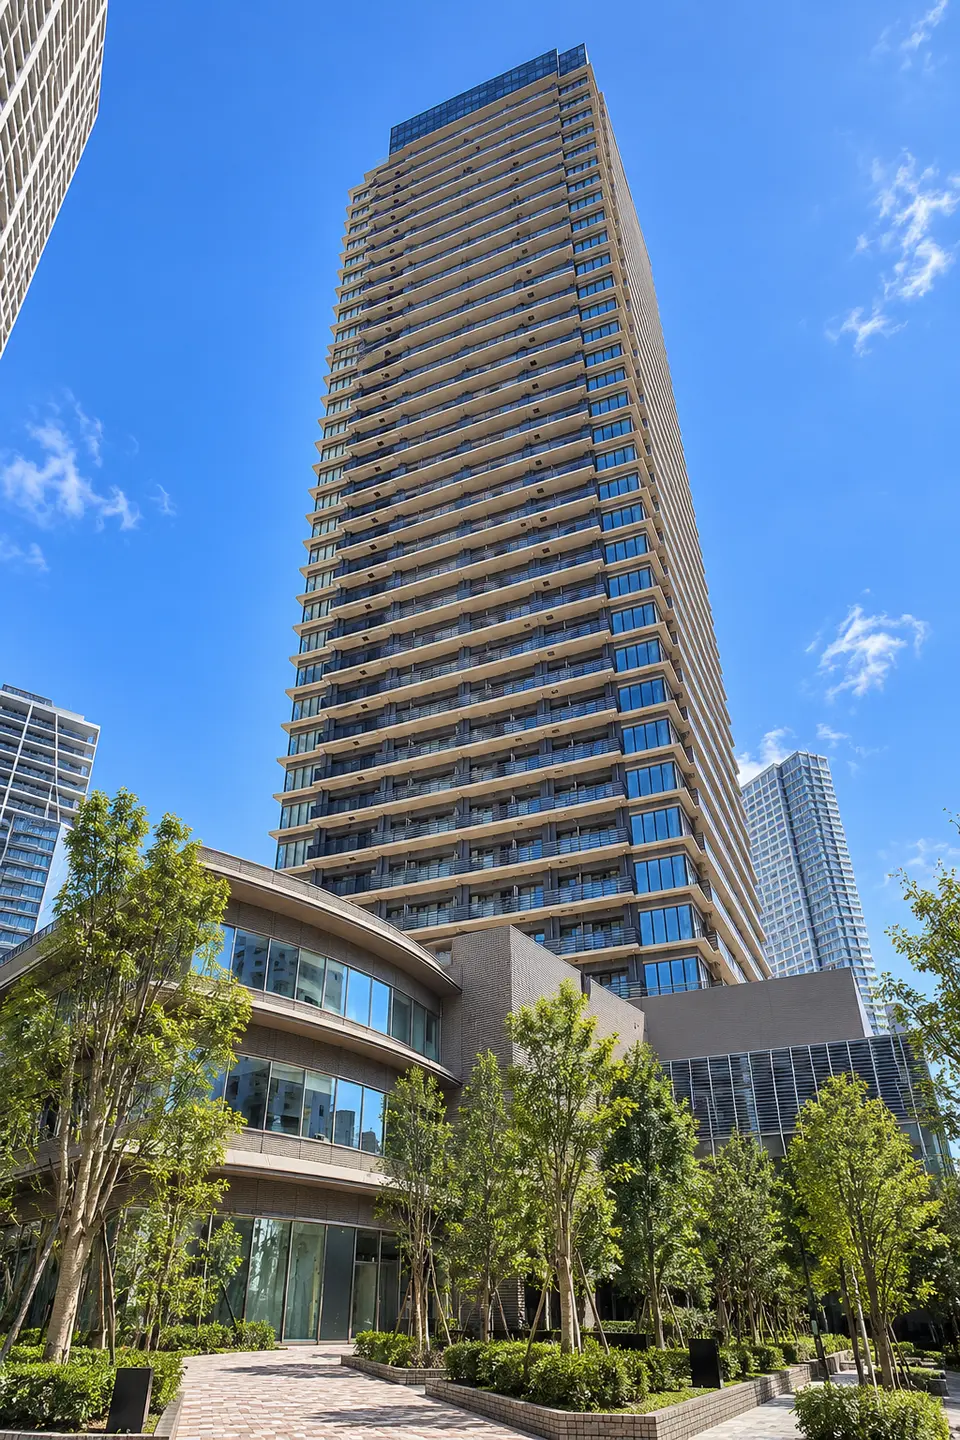
-
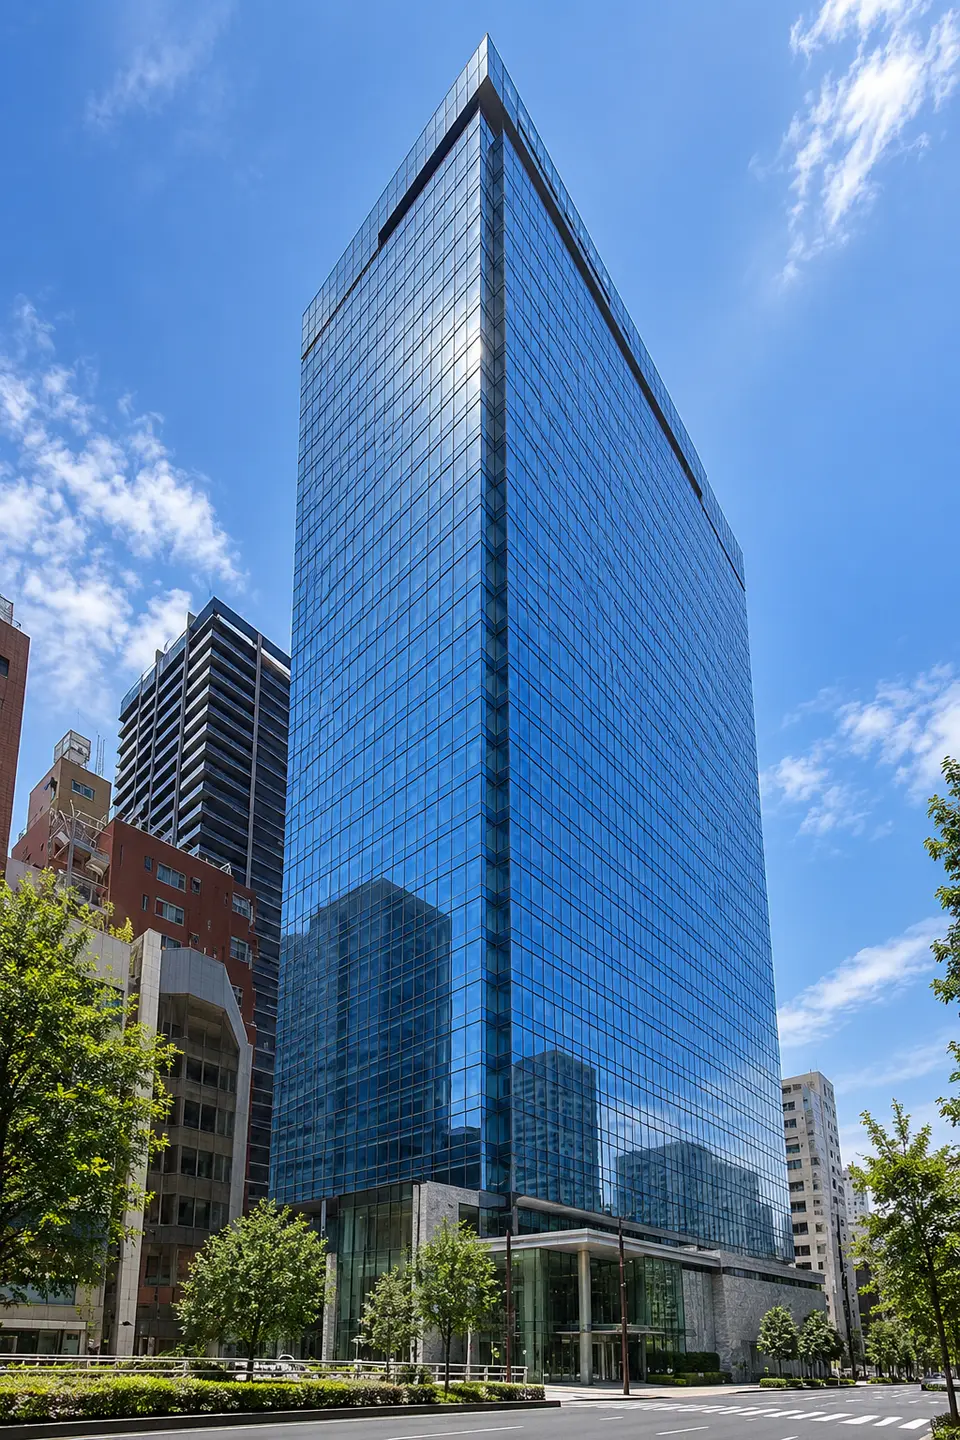
Building and Nearby Land Prices
| buildings | Completed | Number of Floors | Total units | Nearby Land Prices | Year-on-year |
|---|---|---|---|---|---|
| THE PARK HOUSE NISHISHINJUKU TOWER 60 | 2017 | 60 floors | 954 units | 484.3 × ¥10,000/tsubo146.5 × ¥10,000/m²3 points · 105m to the nearest point | +11.7% |
| CITY TOWER SHINJUKU | 2023 | 35 floors | 428 units | 480.0 × ¥10,000/tsubo145.2 × ¥10,000/m²3 points · 241m to the nearest point | +14.8% |
| PARK TOWER NISHISHINJUKU | 2024 | 40 floors | 470 units | 494.5 × ¥10,000/tsubo149.6 × ¥10,000/m²3 points · 108m to the nearest point | +11.5% |
| LA TOUR SHINJUKU FIRST | 2023 | 35 floors | 170 units | 503.2 × ¥10,000/tsubo152.2 × ¥10,000/m²3 points · 241m to the nearest point | +15.5% |
Nearby land value is an average of official land-price points around each building, weighted more heavily toward nearer points. These are point values, not the value of the building's land. “—” indicates a building with no nearby point data.
Nearby official land-price points(2026)
| Location | Use | Price | Year-on-year | 5-year annual average | To nearest building |
|---|---|---|---|---|---|
| 000-009 | 000 | 337.2 × ¥10,000/tsubo102.0 × ¥10,000/m² | +10.7% | +6.3% | 105mReferenced by 4 buildings |
| 000-013 | 000 | 495.9 × ¥10,000/tsubo150.0 × ¥10,000/m² | +17.2% | +9.8% | 241mReferenced by 3 buildings |
| 005-047 | 005 | 1,104.1 × ¥10,000/tsubo334.0 × ¥10,000/m² | +9.9% | +6.1% | 392mReferenced by 2 buildings |
| 005-041 | 005 | 452.9 × ¥10,000/tsubo137.0 × ¥10,000/m² | +16.1% | +6.8% | 423mReferenced by 1 buildings |
| 005-021 | 005 | 783.5 × ¥10,000/tsubo237.0 × ¥10,000/m² | +19.7% | +9.9% | 507mReferenced by 2 buildings |
Points are selected by proximity to buildings in this neighborhood and may include points outside it. Year-on-year and five-year annual averages use prices for the same points rather than reselecting points each year.
Source: Created by TOWERS.SELECT using the Ministry of Land, Infrastructure, Transport and Tourism's National Land Numerical Information “Official Land Prices”