

1L01-14133-005-002Retail space,Office
Official survey location: 35.574083, 139.658384
862.8 ¥10,000/tsubo261.0¥10,000/m²From building 290 m
Year-on-year 11.1%5-year annual average 7.2%
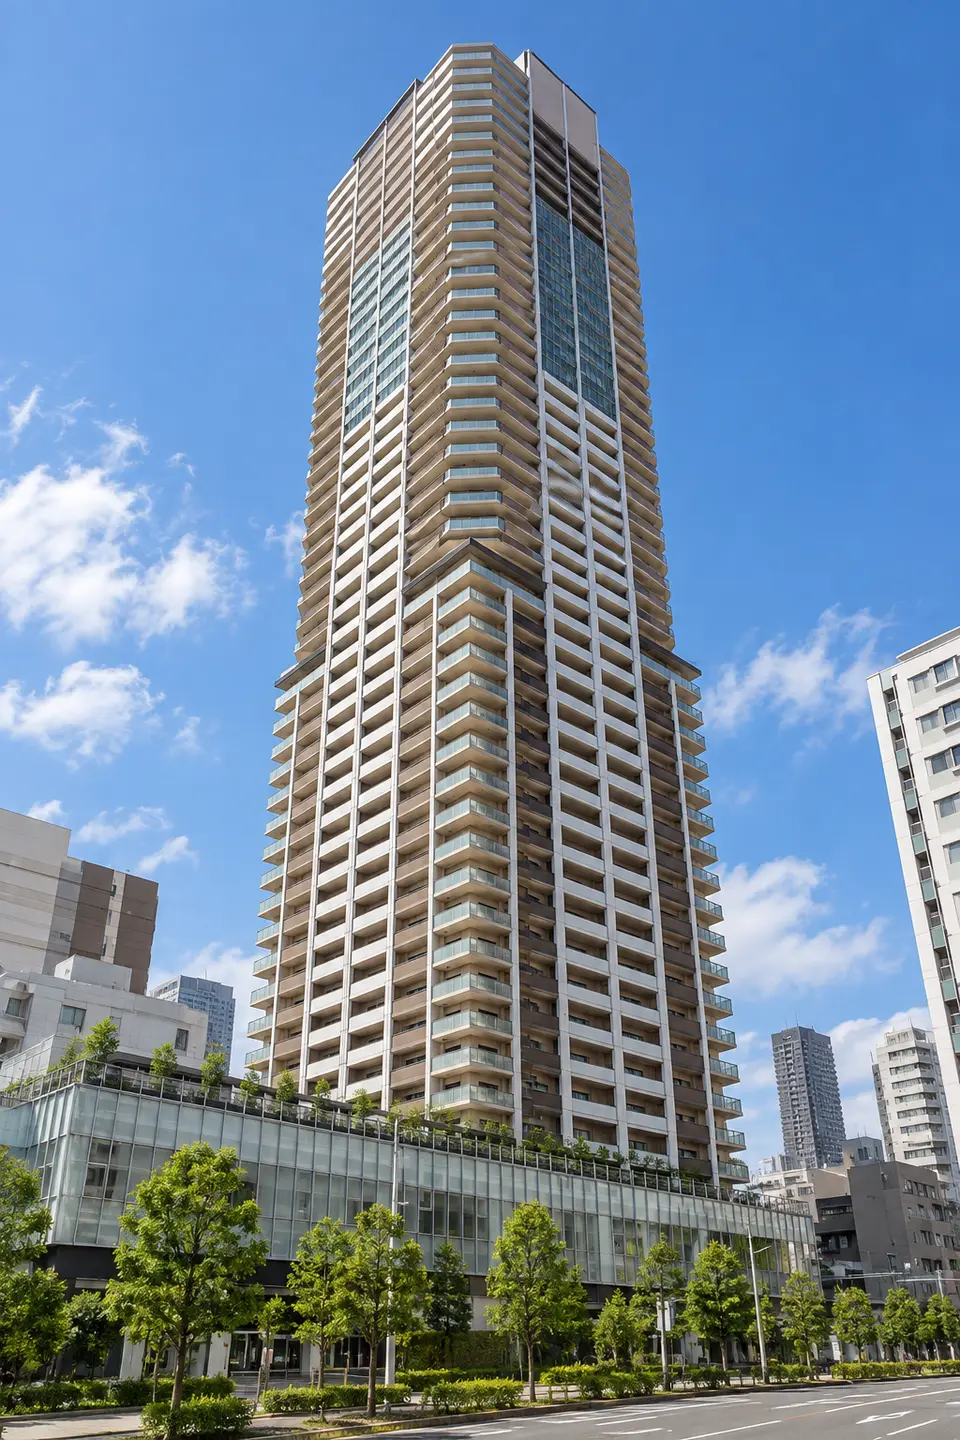
Image|This is a generated image and differs from the actual building.
Public portal listing as of 2026-10-21.
View this unit’s history (listing checks and price revisions)
Estimate sale price and rent using this unit’s floor and sizeEstimate net proceeds from resale
For this unitAsking Price CheckOwnership costsYieldNet Sale Proceeds
Log in to Add to Comparison / Membership Benefits (Free)
View Price per Tsubo distribution by floor / View nearby land prices on the map
PROUD TOWER MUSASHIKOSUGI: 41 floors, 3LDK, 71.3㎡, South-facing unit details. Listed Price: JPY 127,800,000. The AI sale estimate (an indication of a likely sale price) is approximately JPY 118,620,000, and the asking price is 7.7% above the estimate.Compare the price per tsubo within the building.
ROOM ANALYSIS
We assess active listings across five dimensions: appreciation potential, relative value, asset quality, liquidity, and profitability.
Among active listings: top 36%
Standard
Listed 5636 listings 2050 place
Scores are relative assessments centered on 50, not absolute ratings out of 100.
MEMBERS
Factor rankings, scores, and differences from the building average are members-only. Registration is free.
This analysis is for reference and is based on TOWERS.SELECT's proprietary scoring. It does not guarantee investment results. Make decisions based on your own due diligence and consultation with qualified professionals.
Currently listed units in the same building and units confirmed as removed during the most recent 30 days with complete daily collection are shown with floor on the horizontal axis and Price per Tsubo on the vertical axis. All values are the last confirmed asking price or rent, not transaction prices.
Floor 32, 543.02 ¥10,000/tsubo, 70.01㎡, 3LDK, Delisted Oct. 13, 2026, South Orientation
164.26 ¥10,000/m²
View listing history →Floor 13, 681.98 ¥10,000/tsubo, 72.71㎡, 3LDK, West Orientation
206.3 ¥10,000/m²
Floor 19, 601.64 ¥10,000/tsubo, 71.32㎡, 3LDK, South Orientation
182 ¥10,000/m²
Floor 22, 497.47 ¥10,000/tsubo, 79.61㎡, 3LDK, South Orientation
150.48 ¥10,000/m²
Floor 29, 561.3 ¥10,000/tsubo, 74.09㎡, 3LDK, South Orientation
169.79 ¥10,000/m²
Floor 31, 528.85 ¥10,000/tsubo, 70.01㎡, 3LDK, South Orientation
159.98 ¥10,000/m²
Floor 36, 676.75 ¥10,000/tsubo, 61.06㎡, 2LDK, East Orientation
204.72 ¥10,000/m²
Floor 39, 580.04 ¥10,000/tsubo, 74.09㎡, 3LDK, South Orientation
175.46 ¥10,000/m²
Floor 41, 540.14 ¥10,000/tsubo, 67.2㎡, 3LDK, East Orientation
163.39 ¥10,000/m²
Floor 41, 566.91 ¥10,000/tsubo, 72.89㎡, 2LDK, Northeast Orientation
171.49 ¥10,000/m²
Floor 41, 594.46 ¥10,000/tsubo, 61.06㎡, 2LDK, West Orientation
179.82 ¥10,000/m²
Floor 41, 592.37 ¥10,000/tsubo, 71.32㎡, 3LDK, This Unit, South Orientation
179.19 ¥10,000/m²
Units on the same floor with the same unit price are grouped into one point showing the unit count. Differences in size, layout, orientation, and other features also affect the unit price.
This unit's price per tsubo isJPY 5,924,000/tsubo。among the building's activeFor sale among 11 units,中くらい(median JPY 5,800,000/tsubo)。
A price reduction alone does not determine whether a unit is a good value. Compare asking prices in the same building alongside post-purchase payments.
Shows up to six units with the same layout, floor area within ±15%, and floor within ±5 levels, ordered by the smallest area and floor differences. They are not ranked by price or price reduction. Also compare orientation, interior condition, and views.
This unit:12,780¥10,000(592.4 × ¥10,000/tsubo) / management fee + repair reserve 58,420yen/month
Orientation:South / 2026-10-21View
13,000¥10,000580.0¥10,000/tsubo
Management fee + repair reserve (monthly)
60,720yen
Log in to compare these two units
View ownership costs for this unitOrientation:East / 2026-10-21View
10,980¥10,000540.1¥10,000/tsubo
Management fee + repair reserve (monthly)
55,050yen
Log in to compare these two units
View ownership costs for this unitEstimated Sale Price11,862¥10,000
Range Containing 80% of Public Transaction Prices10,398〜13,531¥10,000
Calculation date 2026-10-21
Change criteria and recalculate
The asking price is the seller's requested amount. An appraisal does not guarantee the closing price and varies with interior condition, views, and other factors.
Estimated monthly payment 505,141yen
Down Payment20% per year3.00%・35-year equal principal-and-interest repayment estimate.
| Mortgage paymentEstimate | 393,471yen |
|---|---|
| Management FeeAsking Price | 30,530yen |
| Repair ReserveAsking Price | 27,890yen |
| Estimated property taxesEstimate | 53,250yen |
Down payment:25,560,000yen, with a loan amount of 102,240,000yen。
“Listed amount” is the amount stated in the public listing. “Estimate” is calculated using assumptions; property tax and similar costs are estimated at 0.5% of the asking price per year. Actual taxes, interest rates, and borrowing limits vary by property and borrower. Purchase costs such as brokerage fees, registration fees, fire insurance, and repair reserve funds are excluded. Entered values are calculated only on this device and are neither saved nor transmitted.
This unit: 58,420yen
Building11unit median is58,420yen, a difference of0yen。
15 days or moreearliest confirmed date ·2026-10-06
These are not this unit's own transaction records. They are annual aggregates of Ministry of Land, Infrastructure, Transport and Tourism transactions matched to comparable conditions in the same building.
Comparable transaction price per tsubo
¥10,000/tsuboHollow points indicate years with fewer than 10 transactions. Medians based on small samples can fluctuate, so treat the line as a general trend.
| Year | Transactions | Median price per tsubo | Median price per m² |
|---|---|---|---|
| View 2013 transactions | 65 | JPY 2,865,000/tsubo | JPY 867,000/m² |
| View 2014 transactions | 18 | JPY 2,881,000/tsubo | JPY 871,000/m² |
| View 2015 transactions | 51 | JPY 2,953,000/tsubo | JPY 893,000/m² |
| View 2016 transactions | 1 | JPY 3,589,000/tsubo | JPY 1,086,000/m² |
| View 2017 transactions | 3 | JPY 3,636,000/tsubo | JPY 1,100,000/m² |
| View 2018 transactions | 7 | JPY 4,132,000/tsubo | JPY 1,250,000/m² |
| View 2019 transactions | 4 | JPY 3,754,000/tsubo | JPY 1,136,000/m² |
| View 2020 transactions | 5 | JPY 3,471,000/tsubo | JPY 1,050,000/m² |
| View 2021 transactions | 18 | JPY 3,510,000/tsubo | JPY 1,062,000/m² |
| View 2022 transactions | 13 | JPY 3,825,000/tsubo | JPY 1,157,000/m² |
| View 2023 transactions | 14 | JPY 4,034,000/tsubo | JPY 1,220,000/m² |
| View 2024 transactions | 9 | JPY 4,408,000/tsubo | JPY 1,333,000/m² |
| View 2025 transactions | 13 | JPY 5,372,000/tsubo | JPY 1,625,000/m² |
| View 2026 transactions | 2 | JPY 6,185,000/tsubo | JPY 1,871,000/m² |
LAND PRICE
View the Land-Price Map for Around PROUD TOWER MUSASHIKOSUGI
See how nearby land is valued.
Use the map to check each location and explore prices and their changes.
Official Land Prices · 2026 as of January 1 · Nearby3Location
Average weighted more heavily toward nearer points
Compared with the same points one year earlier · 3Location
Five-year change converted to an annual rate · 3Location
Retail space,Office · Residential,Retail space in 3 reference points used.Prices for each point are listed below. 376.9〜1,100.8 ¥10,000/tsubo。Compare locations and land uses on the map to understand the average.
This is the assessed value per tsubo of land (1 tsubo = 3.30579㎡).This does not represent the unit's price or rent, or the assessed value of the building's site. The same land-value information is shown for every unit in the building.
Loading map. Point locations and prices are also available in the list.
Select a number to view point details. Lines and distances from the building are straight-line measurements.
Official survey location: 35.574083, 139.658384
Year-on-year 11.1%5-year annual average 7.2%
Official survey location: 35.577404, 139.660051
Year-on-year 9.9%5-year annual average 8.1%
Official survey location: 35.579064, 139.658865
Year-on-year 11.8%5-year annual average 8.2%
Because the survey date and locations differ, these values are excluded from the official land-price average above.
Official survey location: 35.572443, 139.656494
Year-on-year 10.1%5-year annual average 5.8%
Official survey location: 35.579572, 139.654365
Year-on-year 5.0%5-year annual average 2.7%
Official survey location: 35.577366, 139.661132
Year-on-year 14.5%5-year annual average 8.1%
Location1(L01-14133-005-002) over time. Unlike the “Indicative nearby land value” above, this tracks one consistent point.
Land-price trend at location 1
¥10,000/tsubo| Year | Price (¥10,000/tsubo) |
|---|---|
| 2012 | 315.7 |
| 2013 | 347.1 |
| 2014 | 386.8 |
| 2015 | 419.8 |
| 2016 | 449.6 |
| 2017 | 476.0 |
| 2018 | 505.8 |
| 2019 | 548.8 |
| 2020 | 595.0 |
| 2021 | 608.3 |
| 2022 | 621.5 |
| 2023 | 651.2 |
| 2024 | 704.1 |
| 2025 | 776.9 |
| 2026 | 862.8 |
Official land prices: search radius 2,000 m, 3locations.
Prefectural Land-Price Survey: search radius 2,000 m, 3locations.reference average 403.0 ¥10,000/tsubo, year-on-year 9.8%, 5-year annual average 5.5%。