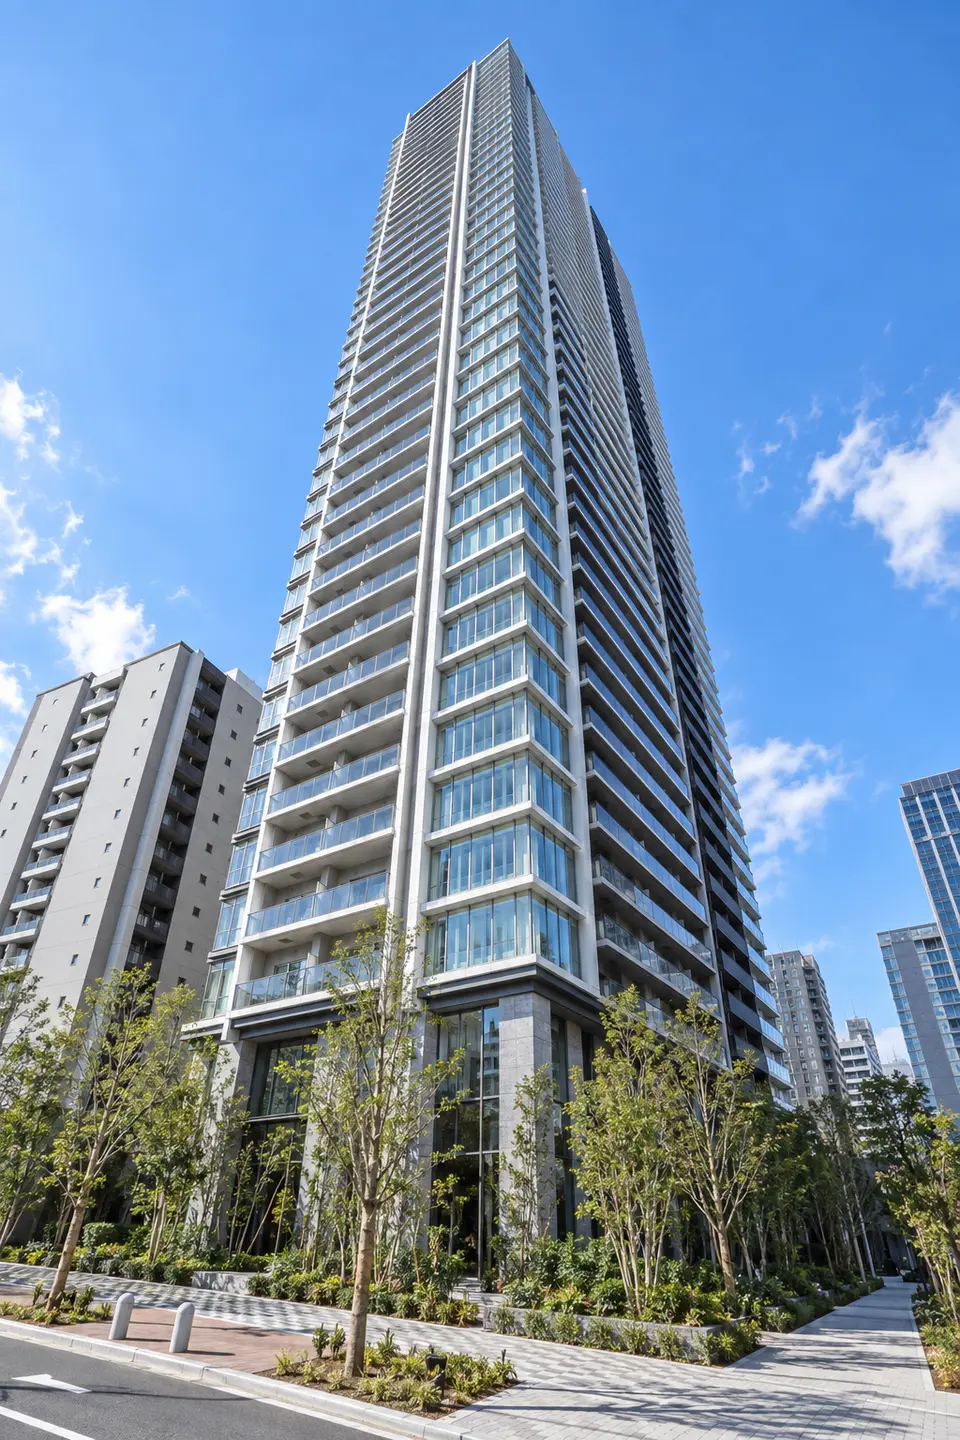
PUREMISUTO TOWER UTSUBOHONMACHI: 13 floors, 2LDK, 56.1㎡, South-facing unit details. Listed rental: JPY 240,000/month. Compare the price per tsubo within the building.
View Simulator Members only
Illustrative image; actual views will differ
Members only · Free registration
See the city from the floor you are considering.
Explore the view from a floor and direction of interest in a 3D cityscape.
Currently listed units in the same building and units confirmed as removed during the most recent 30 days with complete daily collection are shown with floor on the horizontal axis and Price per m² on the vertical axis. All values are the last confirmed asking price or rent, not transaction prices.
For rent JPY/m²/month
Active listings 10Units / Past 30 — listing ended 2Units
Floor 19, 4,698 JPY/m²/month, 71.73㎡, 2LDK, South Orientation
15,530.6 yen/tsubo/month
28 ¥10,000/month
Floor 28, 5,086 JPY/m²/month, 55.05㎡, 1LDK, North Orientation
16,813.25 yen/tsubo/month
24 ¥10,000/month
Floor 13, 4,279 JPY/m²/month, 56.09㎡, 2LDK, This Unit, South Orientation
14,145.48 yen/tsubo/month
Tap a point to see a unit summary and a link to the unit page or listing history here.
Units on the same floor with the same unit price are grouped into one point showing the unit count. Differences in size, layout, orientation, and other features also affect the unit price.Rent is monthly and excludes management and other fees.
The total security deposit and key money is 556,000yen(Deposit is unknown and excluded)。
All amounts are stated in the public listing. Brokerage fees, guarantee fees, fire insurance, lock replacement, and advance rent are excluded because they cannot be determined from the listing.
Management Fee comparison within the building
This unit: 38,000yen
Building7unit median is35,000yen, a difference of3,000yen。
See how nearby land is valued. Use the map to check each location and explore prices and their changes.
Official Land Prices · 2026 as of January 1 · Nearby3Location
Indicative nearby land value1,547.6 ¥10,000/tsubo468.2¥10,000/m²
Average weighted more heavily toward nearer points
Change from previous year16.1 %
Compared with the same points one year earlier · 3Location
5-year annual average9.7 %
Five-year change converted to an annual rate · 3Location
Retail space,Office · Office in 3 reference points used.Prices for each point are listed below. 492.6〜3,504.1 ¥10,000/tsubo。Compare locations and land uses on the map to understand the average.
This is the assessed value per tsubo of land (1 tsubo = 3.30579㎡).This does not represent the unit's price or rent, or the assessed value of the building's site. The same land-value information is shown for every unit in the building.
Loading map. Point locations and prices are also available in the list.
buildings This building1 Official land pricesRef. 1 Reference survey
Select a number to view point details. Lines and distances from the building are straight-line measurements.
Official land prices 2026YearJanuary 1
1L01-27106-005-018Retail space,Office
Official survey location: 34.682374, 135.496377
975.2 ¥10,000/tsubo295.0¥10,000/m²From building 253 m
Year-on-year 16.6%5-year annual average 10.1%
2L01-27128-005-001Retail space,Office
Official survey location: 34.685074, 135.501140
3,504.1 ¥10,000/tsubo1,060.0¥10,000/m²From building 428 m
Year-on-year 15.0%5-year annual average 7.7%
3L01-27106-005-005Office
Official survey location: 34.687731, 135.493177
492.6 ¥10,000/tsubo149.0¥10,000/m²From building 457 m
Year-on-year 16.4%5-year annual average 11.1%
Reference: Prefectural Land Price Survey · 3Location
Prefectural Land-Price Survey 2025YearJuly 1
Because the survey date and locations differ, these values are excluded from the official land-price average above.
Ref. 1L02-27128-005-002Retail space,Office
Official survey location: 34.682380, 135.498877
1,173.6 ¥10,000/tsubo355.0¥10,000/m²From building 334 m
Year-on-year 16.4%5-year annual average 6.8%
Ref. 2L02-27128-005-008Retail space,Office
Official survey location: 34.687629, 135.498521
608.3 ¥10,000/tsubo184.0¥10,000/m²From building 380 m
Year-on-year 14.3%5-year annual average 6.9%
Ref. 3L02-27106-005-002Office
Official survey location: 34.682875, 135.491812
737.2 ¥10,000/tsubo223.0¥10,000/m²From building 471 m
Year-on-year 16.1%5-year annual average 9.0%
How has the nearest point's price changed?
Location1(L01-27106-005-018) over time. Unlike the “Indicative nearby land value” above, this tracks one consistent point.
Land-price trend at location 1
¥10,000/tsubo
Endpoint: 975.2 ¥10,000/tsuboTrace or tap the chart, or focus it and use the left and right arrow keys to inspect values.View annual prices in a table
Year
Price (¥10,000/tsubo)
1994
1,537.2
1995
1,064.5
1996
793.4
1997
664.5
1998
591.7
1999
519.0
2000
413.2
2001
333.9
2002
282.6
2003
251.2
2004
234.7
2005
225.8
2006
244.0
2007
306.8
2008
366.9
2009
337.2
2010
283.3
2011
267.1
2012
263.8
2013
263.8
2014
279.0
2015
293.9
2016
337.2
2017
386.8
2018
446.3
2019
509.1
2020
634.7
2021
601.7
2022
595.0
2023
624.8
2024
727.3
2025
836.4
2026
975.2
How to Read the Figures, Calculation Method, and Sources
Indicative nearby land value
Prices for the listed points are weighted by the inverse of each point's stored distance from the building. For points with verified coordinates, map and list distances are straight-line measurements from the building's current coordinates. If those coordinates were updated, they may differ from the distances used in the calculation. This is not a site valuation adjusted for land use or road conditions.
Change from previous year
Year-on-year changes at the same locations are weighted by distance. “—” means no comparable value is available.
5-year annual average (CAGR)
This converts the change since five years ago into an annual rate, assuming the same rate each year. It is not the total five-year increase. Only comparable points are weighted by distance.
Official land prices: search radius 2,000 m, 3locations.