

1005-014Commercial land
Official survey location: 35.631966, 139.730186
1,176.9 ¥10,000/tsubo356.0¥10,000/m²From building 146 m
Year-on-year 18.3%5-year annual average —
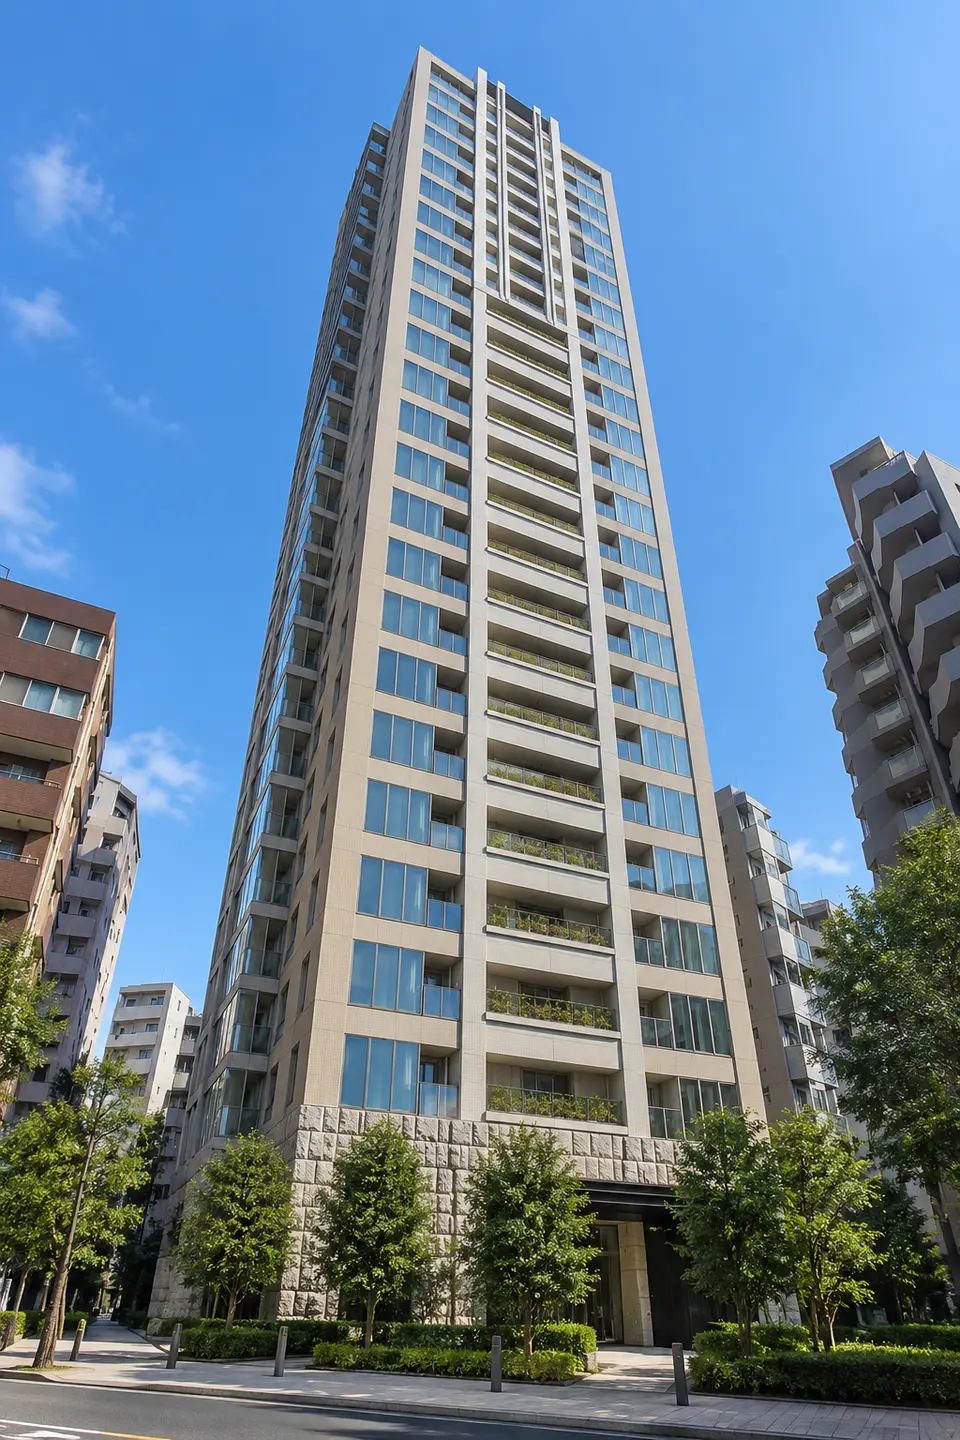
Image|This is a generated image and differs from the actual building.
Public portal listing as of 2026-10-21.
View this unit’s history (listing checks and price revisions)
Estimate rent using this unit’s floor and size
For this unitYield
Log in to Add to Comparison / Membership Benefits (Free)
View Price per Tsubo distribution by floor / View nearby land prices on the map
PROUD TOWER TAKANAWADAI: 8 floors, 2LDK, 54.6㎡, Northwest-facing unit details. Listed rental: JPY 295,000/month. Compare the price per tsubo within the building.
Currently listed units in the same building and units confirmed as removed during the most recent 30 days with complete daily collection are shown with floor on the horizontal axis and Price per Tsubo on the vertical axis. All values are the last confirmed asking price or rent, not transaction prices.
Floor 8, 17,851.27 yen/tsubo/month, 54.63㎡, 2LDK, This Unit, Northwest Orientation
5,400 JPY/m²/month
Units on the same floor with the same unit price are grouped into one point showing the unit count. Differences in size, layout, orientation, and other features also affect the unit price.Rent is monthly and excludes management and other fees.
No comparison is shown because fewer than 3 comparable units are listed in the building.
No comparable units are currently listed.
Monthly payment 295,000yen
Management/common-area fee is not stated in the listing and is excluded from the total.
| rentalAsking Price | 295,000yen |
|---|---|
| Management/common-area feeAsking Price | Unknown (not stated in listing) |
| DepositAsking Price | 590,000yen |
| Key moneyAsking Price | 295,000yen |
The total security deposit and key money is 885,000yen。
All amounts are stated in the public listing. Brokerage fees, guarantee fees, fire insurance, lock replacement, and advance rent are excluded because they cannot be determined from the listing.
This unit: Unavailable
10 days or moreearliest confirmed date ·2026-10-12
LAND PRICE
See how nearby land is valued.
Use the map to check each location and explore prices and their changes.
Official Land Prices · 2026 as of January 1 · Nearby3Location
Average weighted more heavily toward nearer points
Compared with the same points one year earlier · 3Location
Five-year change converted to an annual rate · 2Location
Commercial land · Residential land in 3 reference points used.Prices for each point are listed below. 452.9〜1,176.9 ¥10,000/tsubo。Compare locations and land uses on the map to understand the average.
This is the assessed value per tsubo of land (1 tsubo = 3.30579㎡).This does not represent the unit's price or rent, or the assessed value of the building's site. The same land-value information is shown for every unit in the building.
Loading map. Point locations and prices are also available in the list.
Select a number to view point details. Lines and distances from the building are straight-line measurements.
Official survey location: 35.631966, 139.730186
Year-on-year 18.3%5-year annual average —
Official survey location: 35.631720, 139.727276
Year-on-year 14.2%5-year annual average 7.8%
Official survey location: 35.629333, 139.727271
Year-on-year 16.6%5-year annual average 8.4%
Because the survey date and locations differ, these values are excluded from the official land-price average above.
Official survey location: 35.628471, 139.729579
Year-on-year 14.5%5-year annual average —
Official survey location: 35.633594, 139.731700
Year-on-year 14.4%5-year annual average 6.8%
Official survey location: 35.638542, 139.734274
Year-on-year 17.9%5-year annual average 7.5%
Location1(005-014) over time. Unlike the “Indicative nearby land value” above, this tracks one consistent point.
Land-price trend at location 1
¥10,000/tsubo| Year | Price (¥10,000/tsubo) |
|---|---|
| 2022 | 786.8 |
| 2023 | 813.2 |
| 2024 | 872.7 |
| 2025 | 995.0 |
| 2026 | 1,176.9 |
Official land prices: search radius 2,000 m, 3locations.
The nearest point five years ago was different: in 2021, 000-001 was nearest, 224 m away. Change rates use only time series for the same point and do not substitute another point.
Prefectural Land-Price Survey: search radius 2,000 m, 3locations.reference average 581.2 ¥10,000/tsubo, year-on-year 14.9%, 5-year annual average 7.0%。
The nearest point five years ago was different: in 2020, 000-001 was nearest, 372 m away. Change rates use only time series for the same point and do not substitute another point.