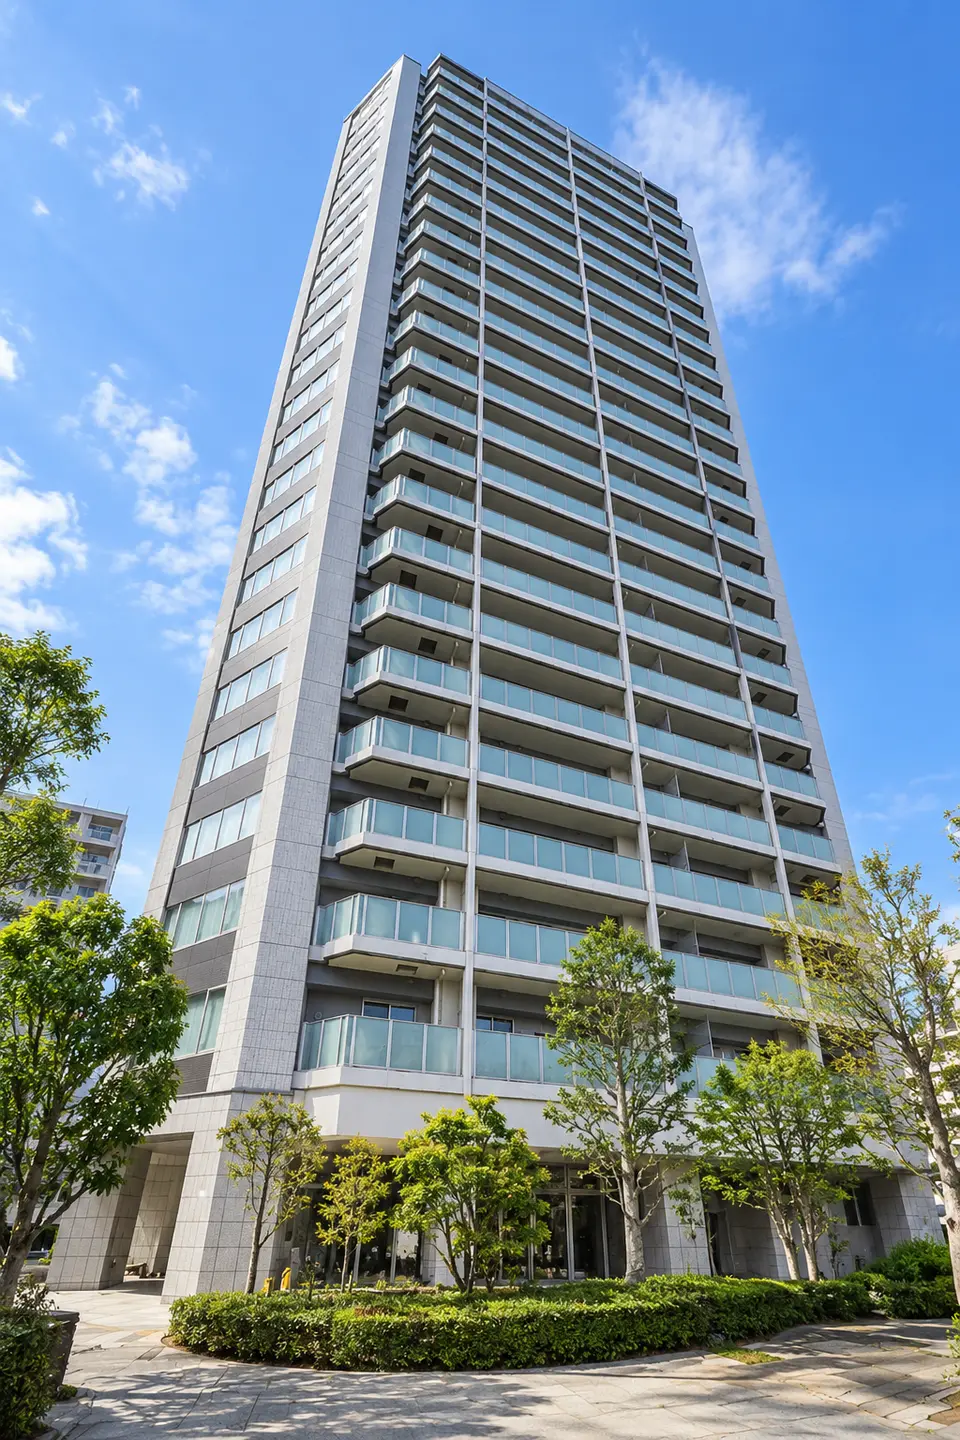
Image|This is a generated image and differs from the actual building.
THE TOWER RESIDENCE OTSUKA
Tokyo 23 Wards, Toshima Ward, Kitaotsuka 1-chome. Above ground: 23 floors, Built in 2012。
Get a Sale & Rent Valuation valuation for a unit in this buildingView Simulator
ToolsAsking Price CheckYieldNet Sale ProceedsOwnership costsResale
Total units 204 units
For sale 2 units
Listing rate 1.0%
For sale2 units ÷ total units204 units・ as of
On iPhone and iPad, add this site to your Home Screen from the Share menu and open it there to receive notifications.
No email address or account is required.
What do you think of this building?
User responses (0 people). This is not a TOWERS.SELECT rating.
Nominate for the TOWERS.SELECT Awards
User responses (0 people). This is not a TOWERS.SELECT rating.
Building information last updated
THE TOWER RESIDENCE OTSUKA is a high-rise condominium in Tokyo, Toshima Ward, Kitaotsuka 1-chome with 23 floors above ground, 204 total units.Completed in 5/2012.Listings shown: 2 units for sale (as of 2026-10-21).
TOWER DOSSIER / 12 FACTS
12-data-point building card
This single card combines verified building-register facts with units identified as currently listed. Unverified information is not presented as “none.”
Building-register values are verified against a source for each field. Listing totals may combine buildings on the same site and use asking prices, not transaction prices. “No listing summary” does not prove that an amenity or listing does not exist.

Reviews, Feedback & Message Board
These posts are from residents and prospective residents. This site has not verified contributors’ residency or their claims. Posts undergo automated screening before publication.
Latest reviews and feedback
No reviews have been published yet.
View Simulator Members only

Asking Price
These are current asking prices, not closed sale prices or sale valuations. For multi-building developments, units on the same site are aggregated.
For sale
Asking Price
Listing summary as of
JPY 126,000,000JPY 152,000,000
- Active listings
- 2 units
- Interior area
- 68.96〜72.47㎡
Monthly total of management and repair reserve fees
43,520〜45,740yen
Range for 2 units with verified cost details.Excludes mortgage payments, taxes, parking, and other costs.
View For sale units and cost details
View area, floor, and median price
| Active listings | 2 Units |
|---|---|
| Price range | JPY 126,000,000–JPY 152,000,000 (median: JPY 139,000,000) |
| Price per tsubo (median) | 648.7 ¥10,000/tsubo |
| Interior area | 68.96 〜 72.47 ㎡ |
| Floor | Floors 4–13 |
| Layout | 2LDK 1, 3LDK 1 |
Units currently for sale or rent
For sale(2 units)
| Price | Price per tsubo / m² | Interior area | Layout | Floor | Orientation | Management fee + repair reserve (monthly) | Occupancy | Estimated listing period | Difference from sale estimate | Overall INDEX |
|---|---|---|---|---|---|---|---|---|---|---|
| 15,200 ¥10,000 | 693.4¥10,000/tsubo209.7¥10,000/m² | 72.47 ㎡ | 3LDK · Corner unit | 13 floor | Southeast | 45,740 yen | — | 38 or more daysOldest observed date・2026-09-13 | +9.2%Est. approx.JPY 139,190,000 | 50.8 |
| 12,600 ¥10,000 | 604¥10,000/tsubo182.7¥10,000/m² | 68.96 ㎡ | 2LDK | 4 floor | Southeast | 43,520 yen | — | 18 or more daysOldest observed date・2026-10-03 | −0.7%Est. approx.JPY 126,870,000 | 52.2 |
Listing checked 2026-10-21
The difference from the sale valuation shows how far the asking price is above (+) or below (−) the estimated sale value. Asking prices normally exceed estimated sale values because they precede reductions and negotiation. Overall INDEX is the composite TOWERS SELECT INVESTMENT INDEX score, a 50-point-based relative assessment of all currently listed units.(calculated 2026-10-21). A breakdown is provided on each unit page. This does not guarantee the closing price or future value.
View this building’s unit history, including past asking prices, price changes, and ended listings →
By FloorPrice per TsuboDistribution
Currently listed units in the same building and units confirmed as removed during the most recent 30 days with complete daily collection are shown with floor on the horizontal axis and Price per Tsubo on the vertical axis. All values are the last confirmed asking price or rent, not transaction prices.
For sale ¥10,000/tsubo
Active listings 2UnitsActive ListingsSale Valuation for a Standard 70㎡ Unit
12,600 ¥10,000
Floor 4, 604.02 ¥10,000/tsubo, 68.96㎡, 2LDK, Southeast Orientation
182.71 ¥10,000/m²
View Unit Page →
15,200 ¥10,000
Floor 13, 693.36 ¥10,000/tsubo, 72.47㎡, 3LDK, Southeast Orientation
209.74 ¥10,000/m²
View Unit Page →Tap a point to see a unit summary and a link to the unit page or listing history here.
View valuation line criteria and floor-by-floor values
- Because Management Fee was not entered, a monthly amount of JPY 21,773 is estimated from the median per-square-meter amount for 2 same-building records (active listing).
- Because Repair Reserve was not entered, a monthly amount of JPY 22,406 is estimated from the median per-square-meter amount for 2 same-building records (active listing).
- Because no direction was entered, the estimate uses the model's neutral value.
- Because corner-unit status is unknown, the estimate uses standard-unit conditions.
- The estimate assumes a vacant sale or rental. It does not reflect interior condition, views, or individual lease terms. If the unit is renovated, select that optional condition to include it in the sale estimate.
- This is an indicative estimate based on the entered conditions. It does not identify a specific active listing and may differ from the estimate on a unit page.
- 1Floor:539.6 ¥10,000/tsubo
- 2Floor:552.9 ¥10,000/tsubo
- 3Floor:563.1 ¥10,000/tsubo
- 4Floor:574.7 ¥10,000/tsubo
- 5Floor:585.6 ¥10,000/tsubo
- 6Floor:592.5 ¥10,000/tsubo
- 7Floor:599.2 ¥10,000/tsubo
- 8Floor:599.5 ¥10,000/tsubo
- 9Floor:598.6 ¥10,000/tsubo
- 10Floor:600.7 ¥10,000/tsubo
- 11Floor:601.8 ¥10,000/tsubo
- 12Floor:605.5 ¥10,000/tsubo
- 13Floor:611.0 ¥10,000/tsubo
- 14Floor:614.0 ¥10,000/tsubo
- 15Floor:620.5 ¥10,000/tsubo
- 16Floor:624.0 ¥10,000/tsubo
- 17Floor:625.9 ¥10,000/tsubo
- 18Floor:632.5 ¥10,000/tsubo
- 19Floor:640.4 ¥10,000/tsubo
- 20Floor:649.5 ¥10,000/tsubo
- 21Floor:655.6 ¥10,000/tsubo
- 22Floor:666.7 ¥10,000/tsubo
- 23Floor:682.0 ¥10,000/tsubo
Units on the same floor with the same unit price are grouped into one point showing the unit count. Differences in size, layout, orientation, and other features also affect the unit price.
View distribution data

For rent yen/tsubo/month
Active listings 0Unitscurrently listed or within the past30listing ended onFor rentNo units available.
Overview
| Item | Value |
|---|---|
| Building | THE TOWER RESIDENCE OTSUKA |
| Location (neighborhood) | Kitaotsuka 1-chome |
| Location (street address) | Tokyo, Toshima Ward, Kitaotsuka 1-chome, 13-2 |
| Above-ground floors | 23 floors above ground |
| Completion date | May 2012 |
| Total units | 204 units |
| Land rights | Freehold |
| Structure | RC |
| Zoning | See the cited source for the official entry |
| Site area | See the cited source for the official entry |
| Building footprint | 1,046.84㎡ |
| Total floor area | See the cited source for the official entry |
| Management arrangement | Daytime staffing See the cited source for the official entry |
| Property management company | See the cited source for the official entry |
| Seller | See the cited source for the official entry |
| Architect | See the cited source for the official entry |
| General contractor | See the cited source for the official entry |
| Structural earthquake protection | See the cited source for the official entry |
| Management Fee | JPY 21,770 per 70 m² |
| Repair Reserve | JPY 22,400 per 70 m² |
| Assigned elementary school | Municipal elementary school assigned by Toshima Ward (see cited source) |
| Assigned junior high school | Municipal junior high school assigned by Toshima Ward (see cited source) |
LOCATION
Location map
LocationTokyo, Toshima Ward, Kitaotsuka 1-chome, 13-2
Loading map.
Amenities and management
This information has been verified from cited sources. “Unverified” does not mean that an amenity is unavailable. Shared complex amenities may not be located within this tower.
| Direct station access | Unverified |
|---|---|
| Structural earthquake protection | Unverified |
| Parking capacity | Mechanical 67 parking spaces (Building) |
| Parking conditions | Unverified |
| Property management company | Unverified |
| Management system and staffing |
Daytime staffing (Building)See the cited source for the official entry (Building)
Values differ between sources. Check their scope and retrieval dates. |
| Repair plans and records | Unverified |
| Guest room | Guest room (Building) |
| Lounge | Lounge (Building) |
| Gym | Unverified |
| Concierge | Concierge (Building) |
| Parcel lockers | Parcel lockers (Building) |
| 24-hour trash disposal on every floor | 24-hour trash disposal on every floor (Building) |
| Interior corridors | Unverified |
Shared amenities
| Services |
|
|---|---|
| Lounges and views |
|
| Guests and social spaces |
|
| Daily-life services |
|
| Parking and bicycle parking |
|
Parking and bicycle parking
| Category | Spaces | Monthly Amount | Size limits and notes |
|---|---|---|---|
| Parking (Mechanical) | 67 parking space |
Parking capacity does not guarantee availability or usage rights. Check management rules and related documents for fees, vehicle restrictions, eligibility, and reservations. Amenities, services, and management arrangements may have changed since the retrieval date.
Frequently asked questions about THE TOWER RESIDENCE OTSUKA
- How many units are currently listed at THE TOWER RESIDENCE OTSUKA?
- Listings as of 2026-10-21: 2 units for sale.
- Which companies handle Construction, Architect, Management for THE TOWER RESIDENCE OTSUKA?
- Construction: the company named in the cited source, Architect: Mitsubishi Jisho Design Inc., Management: the company named in the cited source.
- What shared facilities are available at THE TOWER RESIDENCE OTSUKA?
- Lounge, Guest room, Party room are available.
- Does THE TOWER RESIDENCE OTSUKA offer concierge service or 24-hour staffed security?
- Concierge service is available.
- Can residents dispose of garbage at any time at THE TOWER RESIDENCE OTSUKA?
- There is a garbage collection area on every floor, available 24 hours a day.
- How many parking spaces does THE TOWER RESIDENCE OTSUKA have?
- the parking facility has Mechanical: 67 parking spaces. Availability and rates may change; please check with the property management company.
- Does THE TOWER RESIDENCE OTSUKA use base isolation or seismic response control?
- Structural system: Base isolation.
Market activity by building
View active units, new and removed listings, asking-price ranges, and listing duration for the same date. Buildings on the same site may be aggregated.
Display period: October 6, 2026〜October 21, 2026 (up to 30 days). Earlier market conditions are not estimated; data begins on the first day a daily summary was saved.
For sale market activity Confirmed 16 days / unconfirmed or missing 0Date
Latest confirmed values:October 21, 2026
- Active listings
- 2 units
- New / removed
- 0 / 0 units
- Asking-price range
- 12,600〜15,200¥10,000
- Median listing duration
- 28Date
● New listing● Listing Ended
The thick vertical line shows the middle 50% of prices, and the dot shows the median. Changes in listed units also affect the range.
View daily values and sample sizes
| Confirmation Date | Active listings | New | Removed | Asking-price range and median (¥10,000) | Price per tsubo, middle 50% and median (¥10,000/tsubo) | Median listing duration |
|---|---|---|---|---|---|---|
| 2 units | 0 units | 0 units | 12,600〜15,200 Median 13,900(2 units) | 626.4〜671 Median 648.7(2 units) | 13 days (2 units) | |
| 2 units | 0 units | 0 units | 12,600〜15,200 Median 13,900(2 units) | 626.4〜671 Median 648.7(2 units) | 14 days (2 units) | |
| 2 units | 0 units | 0 units | 12,600〜15,200 Median 13,900(2 units) | 626.4〜671 Median 648.7(2 units) | 15 days (2 units) | |
| 2 units | 0 units | 0 units | 12,600〜15,200 Median 13,900(2 units) | 626.4〜671 Median 648.7(2 units) | 16 days (2 units) | |
| 2 units | 0 units | 0 units | 12,600〜15,200 Median 13,900(2 units) | 626.4〜671 Median 648.7(2 units) | 17 days (2 units) | |
| 2 units | 0 units | 0 units | 12,600〜15,200 Median 13,900(2 units) | 626.4〜671 Median 648.7(2 units) | 18 days (2 units) | |
| 2 units | 0 units | 0 units | 12,600〜15,200 Median 13,900(2 units) | 626.4〜671 Median 648.7(2 units) | 19 days (2 units) | |
| 2 units | 0 units | 0 units | 12,600〜15,200 Median 13,900(2 units) | 626.4〜671 Median 648.7(2 units) | 20 days (2 units) | |
| 2 units | 0 units | 0 units | 12,600〜15,200 Median 13,900(2 units) | 626.4〜671 Median 648.7(2 units) | 21 days (2 units) | |
| 2 units | 0 units | 0 units | 12,600〜15,200 Median 13,900(2 units) | 626.4〜671 Median 648.7(2 units) | 22 days (2 units) | |
| 2 units | 0 units | 0 units | 12,600〜15,200 Median 13,900(2 units) | 626.4〜671 Median 648.7(2 units) | 23 days (2 units) | |
| 2 units | 0 units | 0 units | 12,600〜15,200 Median 13,900(2 units) | 626.4〜671 Median 648.7(2 units) | 24 days (2 units) | |
| 2 units | 0 units | 0 units | 12,600〜15,200 Median 13,900(2 units) | 626.4〜671 Median 648.7(2 units) | 25 days (2 units) | |
| 2 units | 0 units | 0 units | 12,600〜15,200 Median 13,900(2 units) | 626.4〜671 Median 648.7(2 units) | 26 days (2 units) | |
| 2 units | 0 units | 0 units | 12,600〜15,200 Median 13,900(2 units) | 626.4〜671 Median 648.7(2 units) | 27 days (2 units) | |
| 2 units | 0 units | 0 units | 12,600〜15,200 Median 13,900(2 units) | 626.4〜671 Median 648.7(2 units) | 28 days (2 units) |
For rent market activity Confirmed 0 days / unconfirmed or missing 16Date
10/21 is unconfirmed: No listing observations have been recorded for this building yet.. Values for this date are not shown.
View daily values and sample sizes
| Confirmation Date | Active listings | New | Removed | Asking-price range and median (yen/month) | Price per tsubo, middle 50% and median (yen/tsubo/month) | Median listing duration |
|---|---|---|---|---|---|---|
| Unconfirmed or missing: No listing observations have been recorded for this building yet. | ||||||
| Unconfirmed or missing: No listing observations have been recorded for this building yet. | ||||||
| Unconfirmed or missing: No listing observations have been recorded for this building yet. | ||||||
| Unconfirmed or missing: No listing observations have been recorded for this building yet. | ||||||
| Unconfirmed or missing: No listing observations have been recorded for this building yet. | ||||||
| Unconfirmed or missing: No listing observations have been recorded for this building yet. | ||||||
| Unconfirmed or missing: No listing observations have been recorded for this building yet. | ||||||
| Unconfirmed or missing: No listing observations have been recorded for this building yet. | ||||||
| Unconfirmed or missing: No listing observations have been recorded for this building yet. | ||||||
| Unconfirmed or missing: No listing observations have been recorded for this building yet. | ||||||
| Unconfirmed or missing: No listing observations have been recorded for this building yet. | ||||||
| Unconfirmed or missing: No listing observations have been recorded for this building yet. | ||||||
| Unconfirmed or missing: No listing observations have been recorded for this building yet. | ||||||
| Unconfirmed or missing: No listing observations have been recorded for this building yet. | ||||||
| Unconfirmed or missing: No listing observations have been recorded for this building yet. | ||||||
| Unconfirmed or missing: No listing observations have been recorded for this building yet. | ||||||
Dates are this site's observation dates. “New” means first seen, while a removed listing does not necessarily indicate a completed transaction and may include withdrawals. Listing duration is an estimate based on the information date, update date, and first observation date, and may differ from the actual listing start date. Days with unconfirmed collection or unit aggregation are treated as missing and are not connected by lines.
Comparable transactions(Kitaotsuka 1-chome, Built in 2012)
This is not transaction history for this building.Comparable condominium transactions with the same ward, neighborhood, completion year, and structure.
Comparable transactions: 29; period: Q4 2013–Q2 2024.
Comparable transaction price per tsubo
¥10,000/tsuboHollow markers indicate years with fewer than 10 transactions. Medians for small samples can vary widely, so use the line only as a trend guide.
| Year | Transactions | Median price per tsubo | Median price per m² |
|---|---|---|---|
| View 2013 transactions | 1 | 284.3 × ¥10,000/tsubo | 86.0 × ¥10,000/m² |
| View 2014 transactions | 3 | 286.5 × ¥10,000/tsubo | 86.7 × ¥10,000/m² |
| View 2015 transactions | 1 | 355.4 × ¥10,000/tsubo | 107.5 × ¥10,000/m² |
| View 2017 transactions | 1 | 352.6 × ¥10,000/tsubo | 106.7 × ¥10,000/m² |
| View 2018 transactions | 2 | 353.7 × ¥10,000/tsubo | 107.0 × ¥10,000/m² |
| View 2019 transactions | 1 | 360.6 × ¥10,000/tsubo | 109.1 × ¥10,000/m² |
| View 2020 transactions | 1 | 355.4 × ¥10,000/tsubo | 107.5 × ¥10,000/m² |
| View 2021 transactions | 7 | 361.4 × ¥10,000/tsubo | 109.3 × ¥10,000/m² |
| View 2022 transactions | 7 | 390.7 × ¥10,000/tsubo | 118.2 × ¥10,000/m² |
| View 2023 transactions | 4 | 412.0 × ¥10,000/tsubo | 124.6 × ¥10,000/m² |
| View 2024 transactions | 1 | 466.7 × ¥10,000/tsubo | 141.2 × ¥10,000/m² |
—→—: —% (annualized —%, median —→— × ¥10,000/tsubo, MLIT real estate transaction price data)
Prepared by TOWERS.SELECT using MLIT Real Estate Information Library transaction price data (XIT001)
LAND PRICE
Explore Nearby Land Prices
View the Land-Price Map for Around THE TOWER RESIDENCE OTSUKA
See how nearby land is valued.
Use the map to check each location and explore prices and their changes.
Official Land Prices · 2026 as of January 1 · Nearby3Location
Indicative nearby land value634.0 ¥10,000/tsubo191.8¥10,000/m²
Average weighted more heavily toward nearer points
Change from previous year14.9 %
Compared with the same points one year earlier · 3Location
5-year annual average8.3 %
Five-year change converted to an annual rate · 3Location
Residential land · Commercial land in 3 reference points used.Prices for each point are listed below. 328.3〜991.7 ¥10,000/tsubo。Compare locations and land uses on the map to understand the average.
This is the assessed value per tsubo of land (1 tsubo = 3.30579㎡).This does not represent the assessed value of the building's site or the condominium's sale price.
Loading map. Point locations and prices are also available in the list.
buildings This building1 Official land pricesRef. 1 Reference survey
Select a number to view point details. Lines and distances from the building are straight-line measurements.
Official land prices 2026YearJanuary 1
1000-011Residential land
Official survey location: 35.733474, 139.732778
328.3 ¥10,000/tsubo99.3¥10,000/m²From building 196 m
Year-on-year 12.5%5-year annual average 7.6%
2005-022Commercial land
Official survey location: 35.730614, 139.729541
991.7 ¥10,000/tsubo300.0¥10,000/m²From building 247 m
Year-on-year 17.2%5-year annual average 8.6%
3005-009Commercial land
Official survey location: 35.732617, 139.728167
671.1 ¥10,000/tsubo203.0¥10,000/m²From building 333 m
Year-on-year 16.0%5-year annual average 9.0%
Reference: Prefectural Land Price Survey · 3Location
Prefectural Land-Price Survey 2025YearJuly 1
Because the survey date and locations differ, these values are excluded from the official land-price average above.
Ref. 1000-008Residential land
Official survey location: 35.733474, 139.732778
308.4 ¥10,000/tsubo93.3¥10,000/m²From building 196 m
Year-on-year 12.0%5-year annual average 6.3%
Ref. 2005-013Commercial land
Official survey location: 35.732617, 139.728167
621.5 ¥10,000/tsubo188.0¥10,000/m²From building 333 m
Year-on-year 16.0%5-year annual average 7.3%
Ref. 3005-002Commercial land
Official survey location: 35.735748, 139.735015
512.4 ¥10,000/tsubo155.0¥10,000/m²From building 518 m
Year-on-year 14.0%5-year annual average 6.2%
How has the nearest point's price changed?
Location1(000-011) over time. Unlike the “Indicative nearby land value” above, this tracks one consistent point.
Land-price trend at location 1
¥10,000/tsuboView annual prices in a table
| Year | Price (¥10,000/tsubo) |
|---|---|
| 1983 | 200.0 |
| 1984 | 204.0 |
| 1985 | 214.2 |
| 1986 | 239.7 |
| 1987 | 456.2 |
| 1988 | 512.4 |
| 1989 | 512.4 |
| 1990 | 528.9 |
| 1991 | 538.8 |
| 1992 | 482.6 |
| 1993 | 386.8 |
| 1994 | 314.1 |
| 1995 | 279.7 |
| 1996 | 261.2 |
| 1997 | 244.6 |
| 1998 | 232.1 |
| 1999 | 214.9 |
| 2000 | 199.3 |
| 2001 | 185.1 |
| 2002 | 171.9 |
| 2003 | 163.6 |
| 2004 | 158.7 |
| 2005 | 157.7 |
| 2006 | 158.0 |
| 2007 | 180.2 |
| 2008 | 208.9 |
| 2009 | 191.7 |
| 2010 | 178.5 |
| 2011 | 173.6 |
| 2012 | 170.6 |
| 2013 | 169.9 |
| 2014 | 171.9 |
| 2015 | 175.9 |
| 2016 | 181.5 |
| 2017 | 186.1 |
| 2018 | 195.4 |
| 2019 | 210.9 |
| 2020 | 230.1 |
| 2021 | 227.4 |
| 2022 | 233.1 |
| 2023 | 245.3 |
| 2024 | 264.8 |
| 2025 | 291.9 |
| 2026 | 328.3 |
How to Read the Figures, Calculation Method, and Sources
- Indicative nearby land value
- Prices for the listed points are weighted by the inverse of each point's stored distance from the building. For points with verified coordinates, map and list distances are straight-line measurements from the building's current coordinates. If those coordinates were updated, they may differ from the distances used in the calculation. This is not a site valuation adjusted for land use or road conditions.
- Change from previous year
- Year-on-year changes at the same locations are weighted by distance. “—” means no comparable value is available.
- 5-year annual average (CAGR)
- This converts the change since five years ago into an annual rate, assuming the same rate each year. It is not the total five-year increase. Only comparable points are weighted by distance.
Official land prices: search radius 2,000 m, 3locations.
Prefectural Land-Price Survey: search radius 2,000 m, 3locations.reference average 441.2 ¥10,000/tsubo, year-on-year 13.6%, 5-year annual average 6.6%。
Hazard projections and surroundings (official data)
buildingsResults from matching the coordinates against public data from Japan's Ministry of Land, Infrastructure, Transport and Tourism. Being outside a projected zone and having missing or unavailable data are shown as separate states. No value does not mean the location is safe.
Hazard projections
Check official projections for flooding, landslides, and other hazards.
| Liquefaction tendency | Very low liquefaction susceptibilityLandform classification: Loam plateau · level 5 of 6 (1 is the most susceptible to liquefaction) General tendency based on the 250 m grid landform classification; ground improvements and foundation specifications are not reflected. Prepared by TOWERS.SELECT using MLIT liquefaction susceptibility map based on landform classification(retrieved 2026-09-27) |
|---|---|
| Storm-surge inundation projection | Outside projected zone Maximum inundation depth among the projected zones overlapping the coordinates of buildings. Prepared by TOWERS.SELECT using MLIT National Land Numerical Information: Storm Surge Inundation Assumption Areas(retrieved 2026-09-27) |
| Flood inundation projection (maximum assumed scale) | Outside projected zone Highest rank among the river-specific projections overlapping the coordinates of buildings. Prepared by TOWERS.SELECT using MLIT National Land Numerical Information: Flood Inundation Assumption Areas(retrieved 2026-09-27) |
Zoning
Urban-planning categories governing residential, commercial, and other land uses.
| Zoning | Category II residential zoneFloor-area ratio: 400.0% / Building coverage ratio: 60.0% These are the designated floor-area and building coverage ratios, not the actual values or any relaxations applied to this building. Prepared by TOWERS.SELECT using MLIT urban-planning GIS data: Land-use zoning(retrieved 2026-09-27) |
|---|---|
| Fire-prevention and quasi-fire-prevention districts | Fire prevention district Prepared by TOWERS.SELECT using MLIT urban-planning GIS data: Fire-prevention districts(retrieved 2026-09-27) |
Passenger traffic at the nearest station
See the station's usage level and annual changes.
the station named in the cited source stations (Toden Arakawa Line) is a straight-line distance of 204 m. 2023 annual passenger traffic was 7,990 passengers per day.
Daily ridership at the station named in the cited source Station
people/day| Year | Passenger traffic (people/day) |
|---|---|
| 2011 | 9,032 |
| 2012 | 8,962 |
| 2013 | 8,962 |
| 2014 | 8,962 |
| 2015 | 8,962 |
| 2016 | 8,962 |
| 2017 | 7,990 |
| 2018 | 7,990 |
| 2019 | 7,990 |
| 2020 | 7,990 |
| 2021 | 7,990 |
| 2022 | 7,990 |
| 2023 | 7,990 |
Values combine multiple lines at the same station. Distance is measured in a straight line to the station, not as walking time.
Prepared by TOWERS.SELECT using MLIT National Land Numerical Information: Station Passenger Counts(retrieved 2026-09-27)
Projected local population
A projection of how the population within the 250 m grid cell may change.
buildings is in a 250 m grid cell with a projected population of 1,688 people in 2025 to in 2050: 1,939 people(+14.9%)。
Projected population in the 250 m grid cell
people| Year | Projected population |
|---|---|
| 2025 | 1,688 |
| 2030 | 1,767 |
| 2035 | 1,851 |
| 2040 | 1,926 |
| 2045 | 1,948 |
| 2050 | 1,939 |
Projections based on the 2020 census. Areas first occupied after 2020 may not be reflected.
Prepared by TOWERS.SELECT using MLIT National Land Numerical Information: 250 m Mesh Future Population Estimates(retrieved 2026-09-27)
Reference information only. It is not guaranteed for use in important-matters explanations, building applications, or other official procedures (MLIT Real Estate Information Library Terms, Article 3(4)).
Nearby buildings
Buildings in the same chōme are grouped under Kitaotsuka 1-chome .
- Luxury tower condominium ranking in Tokyo 23 WardsA proprietary score based on a same-size reference value, location, scale, and building age
- Listing-Rate Ranking in Tokyo 23 WardsActive sale listings / total units · 403 eligible buildings
- Lowest Asking Rent per Tsubo Ranking in Tokyo 23 WardsRanked by the lowest median asking rent per tsubo among active rental listings
- Management Fees and Repair Reserves per Tsubo in Tokyo 23 WardsRanked by the lowest monthly management and repair reserve fees per unit area among active sale listings
- Leasehold High-Rise Condominiums in Tokyo 23 WardsBuildings with leasehold or superficies rights and their known remaining terms
- Buildings under construction or planned in Tokyo 23 Wards and the supply outlookNumber of buildings and units by scheduled completion year, followed by the list in earliest-completion order
English and alternate names
English names
- THE TOWER RESIDENCE OTSUKA
Alternate names
- THE・TOWER RESIDENCE 大塚 Japanese alias
- THE・タワーレジデンス大塚 Japanese alias
- ザ・TOWER レジデンス大塚 Japanese alias
- ザ・タワー RESIDENCE 大塚 Japanese alias
This page lists English and kana variants derived mechanically from the official name, along with aliases verified to refer to the same building. Differences in character width, spaces, punctuation, middle dots, and long vowel marks are normalized automatically when searching.